AI Powered Storage Market
AI Powered Storage Market Size, Share & Trends Analysis Report by Components (Hardware and Software), by Storage Medium (Hard Disk Drive (HDD) and Solid State Drive (SSD)), by Storage System (Direct-Attached Storage (DAS), Network-Attached Storage (NAS), and Storage Area Network (SAN)), by End-User (BFSI, Healthcare, Media and Entertainment, Retail, Consumer Goods, Manufacturing, and Others) Forecast Period (2024-2031) Update Available - Forecast 2025-2035
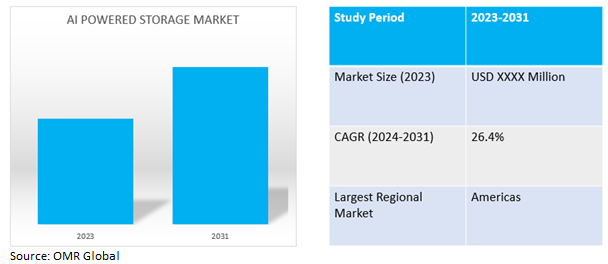
AI powered storage market is anticipated to grow at a significant CAGR of 26.4% during the forecast period (2024-2031). AI-powered storage utilizes artificial intelligence (AI) and machine learning (ML) to optimize storage infrastructure, automate data management tasks, and enhance system performance, ultimately improving efficiency and reliability.

Market Dynamics
Electrification Trends
Growing demand for electric vehicles (EVs) is a primary driver, pushing the adoption of e-axle systems as a key component in electric propulsion. Electric car markets are seeing exponential growth as sales exceeded 10 million in 2022. A total of 14% of all new cars sold were electric in 2022, up from around 9% in 2021 and less than 5% in 2020. Three markets dominated global sales. China was the frontrunner once again, accounting for around 60% of global electric car sales. More than half of the electric cars on roads worldwide are now in China and the country has already exceeded its 2025 target for new energy vehicle sales.
Market Segmentation
Our in-depth analysis of the global AI powered storage market includes the following segments by components, storage medium, storage system, and end-user:
- Based on components, the market is bifurcated into hardware and software.
- Based on storage medium, the market is sub-segmented into HDD and SSD.
- Based on application, the market is augmented into DAS, NAS, and SAN.
- Based on storage medium, the market is sub-segmented into HDD and SSD.
- Based on storage medium, the market is sub-segmented into BFSI, healthcare, media and entertainment, retail, consumer goods, manufacturing, and others. Others includes aerospace and defense, business and consulting, education and research.
HDD is Anticipated to Grow During the Forecast Period
Based on the storage medium, the global AI powered storage market is sub-segmented into HDD and SSD. Among these, the HDD sub-segment is expected to growover the forecast period. The primary factor supporting the segment's growth owing to the improving traction, stability, and handling, especially in challenging road conditions.
Passenger Cars Sub-segment to Hold a Majority Market Sharein the AI Powered Storage Market
By vehicle type, the passenger cars segment holds the majority market share during the forecast period. The increasing adoption of E-axle systems for passenger cars is driven by the demand for the specific requirements of these vehicles, considering factors such as size, weight, and performance characteristics, which cater to the demand for individual or family transportation. The focus is on providing a substantial driving experience for individual consumers or families.Passenger cars have the highest production volume compared to other vehicle segments, resulting in a larger market size for e-axle systems in this sub-segment. According to the International Organization of Motor Vehicle Manufacturers (OICA), passenger car production increased from 55,863,566 in 2020 to 61,598,650 in 2022.
Regional Outlook
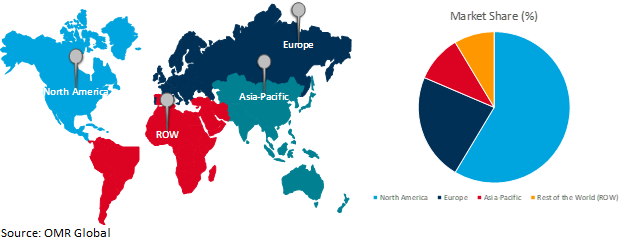
The global AI powered storage market is further segmented based on geography including North America (the US, and Canada), Europe (UK, Italy, Spain, Germany, France, and the Rest of Europe), Asia-Pacific (India, China, Japan, South Korea, and Rest of Asia), and the Rest of the World (the Middle East & Africa, and Latin America).
European countries to invest in EVs
- Europe is investing in charging infrastructure to support the widespread adoption of EVs.
- In volume terms, Germany is the biggest market in Europe with sales of 830,000 in 2022, followed by the UK with 370 000 and France with 330 000.
- Collaboration between automotive OEMs, suppliers, and technology companies in Europe is accelerating the development and commercialization of e-axle systems.
Global AI Powered Storage Market Growth by Region 2024-2031

Asia-pacific Dominates the AI Powered Storage Market
Among all regions, Asia-Pacific holds a significant share in the EV market owing to rising growth, with countries such as China, Japan, and South Korea experiencing increased demand, supported by leading automotive manufacturers including Toyota, Honda, Hyundai, and BYD investing in EV technology and driving innovation in e-axle systems to meet regional demand. According to the Global EV Outlook 2023, China leads global electric car sales, accounting for approximately 60% of the market, surpassing its 2025 target for new energy vehicle sales. Additionally, government incentives, strict emissions regulations, and rising environmental awareness are all contributing to the increased adoption of e-axle systems in EVs. The Government of India has taken some steps to give incentives/ subsidies on EVs to address structural challenges such as high vehicle costs, inadequate charging and maintenance infrastructure, and consumer concerns regarding battery performance. In June 2023, the government reduced the EV subsidy for e-2Ws to 15% of the ex-factory price from 40% under FAME India Scheme Phase-II due to the expanding EV market.
Furthermore, the EV supply chain is expanding, but manufacturing remains highly concentrated in certain regions, with China being the main player in battery and EV component trade. In 2022, 35% of exported electric cars came from China, compared with 25% in 2021. Europe is China’s largest trade partner for both electric cars and their batteries. In 2022, the share of electric cars manufactured in China and sold in the European market increased to 16%, up from about 11% in 2021.
Market Players Outlook

*Note: Major Players Sorted in No Particular Order.
The major companies serving the global AI Powered Storage market include Continental AG, ZF Friedrichshafen AG, Melrose Industries PLC, Dana Ltd., Robert Bosch GmbH, among others. The market players are increasingly focusing on business expansion and product development by applying strategies such as collaborations, mergers, and acquisitions to stay competitive in the market. For instance, in September 2023, Tresa Motors revealed the first e-axle DAX1 and its upgraded version of the medium and heavy electric truck platform Model V0.1, capable of carrying a load capacity ranging from 18 to 55 tons. DAX-1 was powered by its FLUX350 platform motors and operated within the range of 150Kw to 350Kw.
The Report Covers
- Market value data analysis of 2023 and forecast to 2031.
- Annualized market revenues ($ million) for each market segment.
- Country-wise analysis of major geographical regions.
- Key companies operating in the global AI Powered Storage market. Based on the availability of data, information related to new product launches, and relevant news is also available in the report.
- Analysis of business strategies by identifying the key market segments positioned for strong growth in the future.
- Analysis of market-entry and market expansion strategies.
- Competitive strategies by identifying ‘who-stands-where’ in the market.
1. Report Summary
• Current Industry Analysis and Growth Potential Outlook
1.1. Research Methods and Tools
1.2. Market Breakdown
1.2.1. By Segments
1.2.2. By Region
2. Market Overview and Insights
2.1. Scope of the Report
2.2. Analyst Insight & Current Market Trends
2.2.1. Key Findings
2.2.2. Recommendations
2.2.3. Conclusion
3. Competitive Landscape
3.1. Key Company Analysis
3.2. IBM Corp.
3.2.1. Overview
3.2.2. Financial Analysis
3.2.3. SWOT Analysis
3.2.4. Recent Developments
3.3. Dell Technologies Inc.
3.3.1. Overview
3.3.2. Financial Analysis
3.3.3. SWOT Analysis
3.3.4. Recent Developments
3.4. NetApp, Inc.
3.4.1. Overview
3.4.2. Financial Analysis
3.4.3. SWOT Analysis
3.4.4. Recent Developments
3.5. Hewlett Packard Enterprise Co.
3.5.1. Overview
3.5.2. Financial Analysis
3.5.3. SWOT Analysis
3.5.4. Recent Developments
3.6. Key Strategy Analysis
4. Market Segmentation
4.1. Global AI Powered Storage Market by Components
4.1.1. Hardware
4.1.2. Software
4.2. Global AI Powered Storage Market by Storage Medium
4.2.1. Hard Disk Drive (HDD)
4.2.2. Solid State Drive (SSD)
4.3. Global AI Powered Storage Market by Storage System
4.3.1. Direct-Attached Storage (DAS)
4.3.2. Network-Attached Storage (NAS)
4.3.3. Storage Area Network (SAN)
4.4. Global AI Powered Storage Market by End-User
4.4.1. BFSI
4.4.2. Healthcare
4.4.3. Media and Entertainment
4.4.4. Retail
4.4.5. Consumer Goods
4.4.6. Manufacturing
4.4.7. Others (Aerospace and Defense, Business and Consulting, Education and Research)
5. Regional Analysis
5.1. North America
5.1.1. United States
5.1.2. Canada
5.2. Europe
5.2.1. UK
5.2.2. Germany
5.2.3. Italy
5.2.4. Spain
5.2.5. France
5.2.6. Rest of Europe
5.3. Asia-Pacific
5.3.1. China
5.3.2. India
5.3.3. Japan
5.3.4. South Korea
5.3.5. Rest of Asia-Pacific
5.4. Rest of the World
6. Company Profiles
6.1. Advanced Micro Devices, Inc.
6.2. Alphabet Inc. (Google Inc.)
6.3. Amazon Web Services, Inc.
6.4. Cisco Systems Inc.
6.5. Fujitsu Ltd.
6.6. Hitachi, Ltd.
6.7. Intel Corp.
6.8. Lenovo Group Ltd.
6.9. Micron Technology, Inc.
6.10. Microsoft Corp.
6.11. NVIDIA Corp.
6.12. Pure Storage, Inc.
6.13. Samsung Electronics
6.14. Toshiba Corp.
1. GLOBAL AI POWERED STORAGE MARKET RESEARCH AND ANALYSIS BY COMPONENTS, 2023-2031 ($ MILLION)
2. GLOBAL AI POWERED STORAGE HARDWARE MARKET RESEARCH AND ANALYSIS BY REGION, 2023-2031 ($ MILLION)
3. GLOBAL AI POWERED STORAGE SOFTWARE MARKET RESEARCH AND ANALYSIS BY REGION, 2023-2031 ($ MILLION)
4. GLOBAL AI POWERED STORAGE MARKET RESEARCH AND ANALYSIS BY STORAGE MEDIUM, 2023-2031 ($ MILLION)
5. GLOBAL AI POWERED HDD MARKET RESEARCH AND ANALYSIS BY REGION, 2023-2031 ($ MILLION)
6. GLOBAL AI POWERED SSD MARKET RESEARCH AND ANALYSIS BY REGION, 2023-2031 ($ MILLION)
7. GLOBAL AI POWERED STORAGE MARKET RESEARCH AND ANALYSIS BY STORAGE SYSTEM, 2023-2031 ($ MILLION)
8. GLOBAL AI POWERED DAS MARKET RESEARCH AND ANALYSIS BY REGION, 2023-2031 ($ MILLION)
9. GLOBAL AI POWERED NAS MARKET RESEARCH AND ANALYSIS BY REGION, 2023-2031 ($ MILLION)
10. GLOBAL AI POWERED SAN STORAGE MARKET RESEARCH AND ANALYSIS BY REGION, 2023-2031 ($ MILLION)
11. GLOBAL AI POWERED STORAGE MARKET RESEARCH AND ANALYSIS BY END-USER, 2023-2031 ($ MILLION)
12. GLOBAL AI POWERED STORAGE FOR BFSI MARKET RESEARCH AND ANALYSIS BY REGION, 2023-2031 ($ MILLION)
13. GLOBAL AI POWERED STORAGE FOR HEALTHCARE MARKET RESEARCH AND ANALYSIS BY REGION, 2023-2031 ($ MILLION)
14. GLOBAL AI POWERED STORAGE FOR MEDIA AND ENTERTAINMENT MARKET RESEARCH AND ANALYSIS BY REGION, 2023-2031 ($ MILLION)
15. GLOBAL AI POWERED STORAGE FOR RETAIL MARKET RESEARCH AND ANALYSIS BY REGION, 2023-2031 ($ MILLION)
16. GLOBAL AI POWERED STORAGE FOR CONSUMER GOODS MARKET RESEARCH AND ANALYSIS BY REGION, 2023-2031 ($ MILLION)
17. GLOBAL AI POWERED STORAGE FOR MANUFACTURING MARKET RESEARCH AND ANALYSIS BY REGION, 2023-2031 ($ MILLION)
18. GLOBAL AI POWERED STORAGE FOR OTHER END-USERS MARKET RESEARCH AND ANALYSIS BY REGION, 2023-2031 ($ MILLION)
19. GLOBAL AI POWERED STORAGE MARKET RESEARCH AND ANALYSIS BY REGION, 2023-2031 ($ MILLION)
20. NORTH AMERICAN AI POWERED STORAGE MARKET RESEARCH AND ANALYSIS BY COUNTRY, 2023-2031 ($ MILLION)
21. NORTH AMERICAN AI POWERED STORAGE MARKET RESEARCH AND ANALYSIS BY COMPONENTS, 2023-2031 ($ MILLION)
22. NORTH AMERICAN AI POWERED STORAGE MARKET RESEARCH AND ANALYSIS BY STORAGE MEDIUM, 2023-2031 ($ MILLION)
23. NORTH AMERICAN AI POWERED STORAGE MARKET RESEARCH AND ANALYSIS BY STORAGE SYSTEM, 2023-2031 ($ MILLION)
24. NORTH AMERICAN AI POWERED STORAGE MARKET RESEARCH AND ANALYSIS BY END-USER, 2023-2031 ($ MILLION)
25. EUROPEAN AI POWERED STORAGE MARKET RESEARCH AND ANALYSIS BY COUNTRY, 2023-2031 ($ MILLION)
26. EUROPEAN AI POWERED STORAGE MARKET RESEARCH AND ANALYSIS BY COMPONENTS, 2023-2031 ($ MILLION)
27. EUROPEAN AI POWERED STORAGE MARKET RESEARCH AND ANALYSIS BY STORAGE MEDIUM, 2023-2031 ($ MILLION)
28. EUROPEAN AI POWERED STORAGE MARKET RESEARCH AND ANALYSIS BY STORAGE SYSTEM, 2023-2031 ($ MILLION)
29. EUROPEAN AI POWERED STORAGE MARKET RESEARCH AND ANALYSIS BY END-USER, 2023-2031 ($ MILLION)
30. ASIA-PACIFIC AI POWERED STORAGE MARKET RESEARCH AND ANALYSIS BY COUNTRY, 2023-2031 ($ MILLION)
31. ASIA-PACIFIC AI POWERED STORAGE MARKET RESEARCH AND ANALYSIS BY COMPONENTS, 2023-2031 ($ MILLION)
32. ASIA-PACIFIC AI POWERED STORAGE MARKET RESEARCH AND ANALYSIS BY STORAGE MEDIUM, 2023-2031 ($ MILLION)
33. ASIA-PACIFIC AI POWERED STORAGE MARKET RESEARCH AND ANALYSIS BY STORAGE SYSTEM, 2023-2031 ($ MILLION)
34. ASIA-PACIFIC AI POWERED STORAGE MARKET RESEARCH AND ANALYSIS BY END-USER, 2023-2031 ($ MILLION)
35. REST OF THE WORLD AI POWERED STORAGE MARKET RESEARCH AND ANALYSIS BY REGION, 2023-2031 ($ MILLION)
36. REST OF THE WORLD AI POWERED STORAGE MARKET RESEARCH AND ANALYSIS BY COMPONENTS, 2023-2031 ($ MILLION)
37. REST OF THE WORLD AI POWERED STORAGE MARKET RESEARCH AND ANALYSIS BY STORAGE MEDIUM, 2023-2031 ($ MILLION)
38. REST OF THE WORLD AI POWERED STORAGE MARKET RESEARCH AND ANALYSIS BY STORAGE SYSTEM, 2023-2031 ($ MILLION)
39. REST OF THE WORLD AI POWERED STORAGE MARKET RESEARCH AND ANALYSIS BY END-USER, 2023-2031 ($ MILLION)
1. GLOBAL AI POWERED STORAGE MARKET SHARE BY COMPONENTS, 2023 VS 2031 (%)
2. GLOBAL AI POWERED STORAGE HARDWARE MARKET SHARE BY REGION, 2023 VS 2031 (%)
3. GLOBAL AI POWERED STORAGE SOFTWARE MARKET SHARE BY REGION, 2023 VS 2031 (%)
4. GLOBAL AI POWERED STORAGE MARKET SHARE BY STORAGE MEDIUM, 2023 VS 2031 (%)
5. GLOBAL AI POWERED HDD MARKET SHARE BY REGION, 2023 VS 2031 (%)
6. GLOBAL AI POWERED SSD MARKET SHARE BY REGION, 2023 VS 2031 (%)
7. GLOBAL AI POWERED STORAGE MARKET SHARE BY STORAGE SYSTEM, 2023 VS 2031 (%)
8. GLOBAL AI POWERED DAS MARKET SHARE BY REGION, 2023 VS 2031 (%)
9. GLOBAL AI POWERED NAS MARKET SHARE BY REGION, 2023 VS 2031 (%)
10. GLOBAL AI POWERED SAN STORAGE MARKET SHARE BY REGION, 2023 VS 2031 (%)
11. GLOBAL AI POWERED STORAGE MARKET RESEARCH AND ANALYSIS BY END-USER, 2023 VS 2031 (%)
12. GLOBAL AI POWERED STORAGE FOR BFSI MARKET SHARE BY REGION, 2023 VS 2031 (%)
13. GLOBAL AI POWERED STORAGE FOR HEALTHCARE MARKET SHARE BY REGION, 2023 VS 2031 (%)
14. GLOBAL AI POWERED STORAGE FOR MEDIA AND ENTERTAINMENT MARKET SHARE BY REGION, 2023 VS 2031 (%)
15. GLOBAL AI POWERED STORAGE FOR RETAIL MARKET SHARE BY REGION, 2023 VS 2031 (%)
16. GLOBAL AI POWERED STORAGE FOR CONSUMER GOODS MARKET SHARE BY REGION, 2023 VS 2031 (%)
17. GLOBAL AI POWERED STORAGE FOR MANUFACTURING MARKET SHARE BY REGION, 2023 VS 2031 (%)
18. GLOBAL AI POWERED STORAGE FOR OTHER APPLICATION MARKET SHARE BY REGION, 2023 VS 2031 (%)
19. GLOBAL AI POWERED STORAGE MARKET SHARE BY REGION, 2023 VS 2031 (%)
20. US AI POWERED STORAGE MARKET SIZE, 2023-2031 ($ MILLION)
21. CANADA AI POWERED STORAGE MARKET SIZE, 2023-2031 ($ MILLION)
22. UK AI POWERED STORAGE MARKET SIZE, 2023-2031 ($ MILLION)
23. FRANCE AI POWERED STORAGE MARKET SIZE, 2023-2031 ($ MILLION)
24. GERMANY AI POWERED STORAGE MARKET SIZE, 2023-2031 ($ MILLION)
25. ITALY AI POWERED STORAGE MARKET SIZE, 2023-2031 ($ MILLION)
26. SPAIN AI POWERED STORAGE MARKET SIZE, 2023-2031 ($ MILLION)
27. REST OF EUROPE AI POWERED STORAGE MARKET SIZE, 2023-2031 ($ MILLION)
28. INDIA AI POWERED STORAGE MARKET SIZE, 2023-2031 ($ MILLION)
29. CHINA AI POWERED STORAGE MARKET SIZE, 2023-2031 ($ MILLION)
30. JAPAN AI POWERED STORAGE MARKET SIZE, 2023-2031 ($ MILLION)
31. SOUTH KOREA AI POWERED STORAGE MARKET SIZE, 2023-2031 ($ MILLION)
32. REST OF ASIA-PACIFIC AI POWERED STORAGE MARKET SIZE, 2023-2031 ($ MILLION)
33. REST OF THE WORLD AI POWERED STORAGE MARKET SIZE, 2023-2031 ($ MILLION)


