Augmented Analytics Market
Augmented Analytics Market Size, Share & Trends Analysis Report by Component (Software, and Services), By Services (Training and Consulting, Deployment and Integration, and Support and Maintenance), By Deployment Mode (On-Premises, and Cloud Based), and by Verticals (BFSI, Telecom & IT, Retail & Consumer Goods, Healthcare & Life sciences, Manufacturing, Governments & Defense and Others (Energy & Utilities, Transportation & Logistics, Media & Entertainment)) Forecast Period (2024-2031)
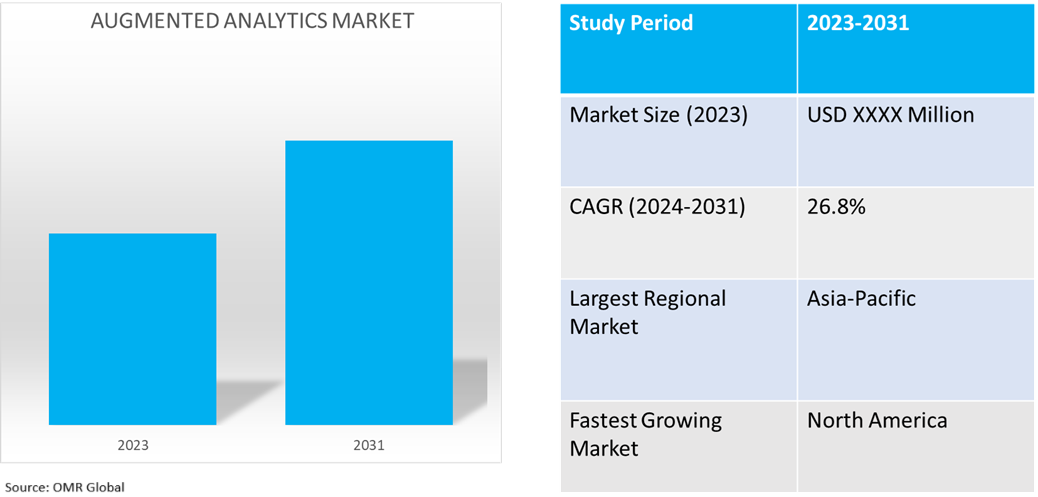
Augmented analytics market is anticipated to grow at a significant CAGR of 26.8% during the forecast period (2024-2031). Augmented analytics is popular owing to larger data, the use of AI and ML, the increasing acceptance of data-driven decision-making strategies, automation, cloud-integrated business intelligence, and applications that include health care, finance, retail, and manufacturing. It helps in analyzing data, optimizing customer behavior, and gaining a competitive advantage.

Market Dynamics
Increasing Data Volume and Complexity
To manage, analyze, and extract useful insights from big and diverse data sources and help organizations make data-driven, well-informed decisions, augmented analytics solutions are necessary. Furthermore, the companies are introducing innovative technologies and platforms to meet these challenges and drive enterprise AI adoption. For instance, in June 2024, Qlik introduced the Qlik Talend Cloud and Qlik Answers. The adoption of enterprise AI will be accelerated by these new solutions. Qlik Talend Cloud offers no-code to pro-code, AI-augmented data connection capabilities and Qlik Answers offers AI-generated responses from raw data with complete explainability.
Expansion of Cloud Infrastructure
Cloud infrastructure is particularly useful in supporting augmented analytics therefore it provides scalability and processing data in real-time with seamless integration with enterprise systems. It is common for technology providers to form strategic collaborations to create innovative options that are AI-based, as more and more companies aim to host analytics in the cloud. For instance, in April 2024, the Cloud Software Group completed an eight-year collaboration agreement with Microsoft, increasing its work on Citrix's virtual application and desktop platform. The agreement builds new capabilities for the cloud and AI solution as Cloud Software Group is investing $1.65 billion in the generative AI capabilities of the Microsoft cloud. Citrix has selected the Global Azure Partner solution for Microsoft's Enterprise Desktop as a Service because the product will help customers attain tailored solutions and, more importantly, an up-to-date option for procurement.
Market Segmentation
- Based on the component, the market is segmented into software and services.
- Based on the services, the market is segmented into training and consulting, deployment and integration, and support and maintenance.
- Based on the deployment mode, the market is segmented into on-premises and cloud-based.
- Based on the verticals, the market is segmented into BFSI, telecom & IT, retail & consumer goods, healthcare & life sciences, manufacturing, governments & defense, and others.
The BFSI Segment is projected to Hold the Largest Market Share
Banks can examine large amounts of consumer data using augmented analytics, allowing them to see patterns and trends that conventional analysis may have missed. Banks can provide more personalized services, such as tailored product offerings and targeted marketing campaigns, by leveraging AI and machine learning to better understand consumer preferences, expenditure habits, and risk profiles. In October 2024, Citi partnered with Google to use AI and cloud technology to boost its digital strategy. The collaboration is proposed to use Google Cloud’s expertise to upgrade the banking IT infrastructure. Citi will be able to deliver better digital products, optimize employee workflows, and run high-performance computing (HPC) and analytics platforms through this partnership. Also, Citi will use Google Cloud’s Vertex AI platform to provide generative AI capabilities throughout the organization. Google Cloud can assist Citi's generative AI initiatives by providing document processing and digitalization capabilities to empower customer service teams.
In nations such as India, government and regulatory bodies are encouraging digital payments through UPI, BHIM, and Aadhaar-linked banking through augmented analytics that monitor trends and detect fraud. The Indian banking system comprises 12 small finance banks, 13 public sector banks, 44 foreign banks, and 21 private sector banks. In June 2024, India had a total of 15,17,580 micro-ATMs, along with 1,26,772 on-site ATMs and Cash Recycling Machines (CRMs).
Cloud-Based Segment to Hold a Considerable Market Share
The platform optimizes cloud infrastructure costs by enhancing efficiency and reducing unpredictable query costs, thus helping companies manage increasing data warehouse costs. In October 2023, GoodData launched FlexQuery Analytics Lake end-to-end data platform overseeing metadata, metrics, and predictive models ensuring speed, agility, and high scale with high-quality products. The product utilizes the Apache Arrow and Intel AVX-512 architectures which cut unpredictable cloud data warehouse query processing in return to make query times and costs low.
Regional Outlook
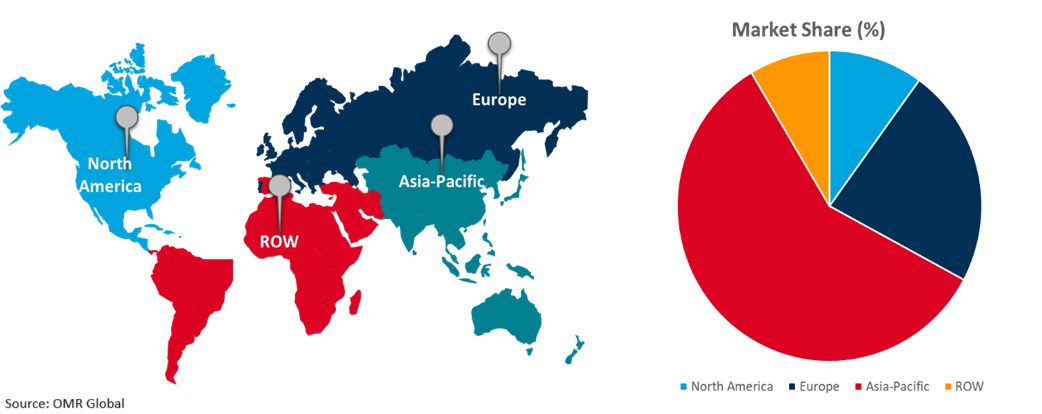
The global augmented analytics market is further segmented based on region including North America (the US, and Canada), Europe (France, Germany, the UK, Italy, Spain, and the Rest of Europe), Asia-Pacific (India, China, Japan, South Korea, and Rest of Asia-Pacific), and the Rest of the World (the Middle East & Africa, and Latin America).
Growing Demand for Data-Driven Awareness in the North America Region
The demand for data-driven insights is growing as organizations look to address workforce issues, improve operations, and boost productivity. Recent strategic partnerships are using advanced analytics to enhance workforce management and raise employee engagement. Recently, in November 2024, Umwelt. AI partnered with PeopleStrong to transform the employee experience and simplify the HR process. The collaboration enables complex HR transformations via people analytics and engagement solutions offered by Umwelt. AI.
Global Augmented Analytics Market Growth by Region 2024-2031

Asia-Pacific Holds Major Market Share
The accelerated pace of digital transformation is a major factor propelling the growth of the augmented analytics market in the Asia-Pacific region. Augmented analytics is becoming a vital tool to efficiently satisfy the demands of businesses, who are prioritizing advanced techniques to manage and extract value from the large and complex datasets created in the present digital ecosystem. For instance, in August 2024, Alibaba Cloud announced a series of new initiatives including expanded talent training for startups and rural area communities, an upgraded AI-focused partnership program, and the latest AI platform to boost AI adoption and fuel Malaysia’s digital transformation and innovation roadmap. After confirming in May that it would build its third data center in Malaysia within three years, this move demonstrates Alibaba Cloud's ongoing commitment to expanding its localization program.
Furthermore, the Indian tech industry is witnessing significant investments in AI and analytics businesses, increasing market growth. India has advanced significantly in the generative artificial intelligence sector, ranking sixth among major global economies in terms of GenAI startup ecosystems. India's GenAI investment increased sixfold in Q2 FY25, as reported by NASSCOM, from $8 million in Q1 FY25 to $51 million. Driven by enterprise applications and agentic AI, the spike in funding activity saw a record 20 rounds of investment, with total funding increasing 3.4 times year over year. Three startups Nurix AI, Dashtoon, and Mihup received more than 90% of the funding.
Market Players Outlook

*Note: Major Players Sorted in No Particular Order.
The major companies serving the augmented analytics market include Salesforce, Inc., IBM Corp., Microsoft, Google LLC (Alphabet Inc.), SAP SE, and others. The market players are increasingly focusing on business expansion and product development by applying strategies such as collaborations, mergers and acquisitions to stay competitive in the market.
Recent Developments
- In May 2024, Accenture partnered with Oracle to accelerate the digitization of finance across industries on Oracle Cloud Infrastructure Generative AI. The solution provided procurement spend analysis, demand forecasting, and dynamic scenario planning.
- In March 2024, SAP and NVIDIA partnered to accelerate enterprise customers in the exploitation of data and generative AI in their cloud solutions and applications. This partnership mainly aims at developing scalable, business-specific SAP Business AI capabilities within Joule copilot and its related solutions within SAP cloud solutions. The collaboration utilizes NVIDIA's generative AI foundry service for the application domains.
The Report Covers
- Market value data analysis of 2023 and forecast to 2031.
- Annualized market revenues ($ million) for each market segment.
- Country-wise analysis of major geographical regions.
- Key companies operating in the global augmented analytics market. Based on the availability of data, information related to new products, and relevant news is also available in the report.
- Analysis of business strategies by identifying the key market segments positioned for strong growth in the future.
- Analysis of market-entry and market expansion strategies.
- Competitive strategies by identifying ‘who-stands-where’ in the market.
1. Report Summary
• Current Industry Analysis and Growth Potential Outlook
1.1. Research Methods and Tools
1.2. Market Breakdown
1.2.1. By Segments
1.2.2. By Region
2. Market Overview and Insights
2.1. Scope of the Report
2.2. Analyst Insight & Current Market Trends
2.2.1. Key Industry Trends
2.2.2. Recommendations
2.2.3. Conclusion
3. Competitive Landscape
3.1. Key Company Analysis
3.2. Microsoft Corp.
3.2.1. Overview
3.2.2. Financial Analysis
3.2.3. SWOT Analysis
3.2.4. Recent Developments
3.3. Google LLC (Alphabet Inc.)
3.3.1. Overview
3.3.2. Financial Analysis
3.3.3. SWOT Analysis
3.3.4. Recent Developments
3.4. Salesforce, Inc.
3.4.1. Overview
3.4.2. Financial Analysis
3.4.3. SWOT Analysis
3.4.4. Recent Developments
3.5. IBM Corp.
3.5.1. Overview
3.5.2. Financial Analysis
3.5.3. SWOT Analysis
3.5.4. Recent Developments
3.6. SAP SE
3.6.1. Overview
3.6.2. Financial Analysis
3.6.3. SWOT Analysis
3.6.4. Recent Developments
3.7. Key Strategy Analysis
4. Market Segmentation
4.1. Global Augmented Analytics Market by Component
4.1.1. Software
4.1.2. Services
4.2. Global Augmented Analytics Market by Services
4.2.1. Training and Consulting
4.2.2. Deployment and Integration
4.2.3. Support and Maintenance
4.3. Global Augmented Analytics Market by Deployment Mode
4.3.1. On-Premises
4.3.2. Cloud-Based
4.4. Global Augmented Analytics Market by Verticals
4.4.1. BFSI
4.4.2. Telecom & IT
4.4.3. Retail & Consumer Goods
4.4.4. Healthcare & Life sciences
4.4.5. Manufacturing
4.4.6. Governments & Defense
4.4.7. Others (Energy & Utilities, Transportation & Logistics, Media & Entertainment)
5. Regional Analysis
5.1. North America
5.1.1. United States
5.1.2. Canada
5.2. Europe
5.2.1. UK
5.2.2. Germany
5.2.3. Italy
5.2.4. Spain
5.2.5. France
5.2.6. Rest of Europe
5.3. Asia-Pacific
5.3.1. China
5.3.2. India
5.3.3. Japan
5.3.4. South Korea
5.3.5. Rest of Asia-Pacific
5.4. Rest of the World
5.4.1. Latin America
5.4.2. Middle East and Africa
6. Company Profiles
6.1. Amazon Web Services, Inc.
6.2. Cloud Software Group, Inc.
6.3. Databricks, Inc.
6.4. Domo, Inc.
6.5. GoodData Corp.
6.6. Yellow Fin (Idera, Inc.)
6.7. Infor
6.8. Informatica, Inc.
6.9. MicroStrategy Inc.
6.10. Oracle Corp.
6.11. QlikTech International AB
6.12. SAS Institute Inc.
6.13. Sisense, Ltd.
6.14. Splunk, LLC
6.15. ThoughtSpot Inc.
6.16. Zoho Corporation Pvt. Ltd.
1. Global Augmented Analytics Market Research And Analysis By Component, 2023-2031 ($ Million)
2. Global Augmented Analytics Software Market Research And Analysis By Region, 2023-2031 ($ Million)
3. Global Augmented Analytics Services Market Research And Analysis By Region, 2023-2031 ($ Million)
4. Global Augmented Analytics Market Research And Analysis By Services, 2023-2031 ($ Million)
5. Global Augmented Analytics For Training and Consulting Market Research And Analysis By Region, 2023-2031 ($ Million)
6. Global Augmented Analytics For Deployment and Integration Market Research And Analysis By Region, 2023-2031 ($ Million)
7. Global Augmented Analytics For Support and Maintenance Market Research And Analysis By Region, 2023-2031 ($ Million)
8. Global Augmented Analytics Market Research And Analysis By Deployment Mode, 2023-2031 ($ Million)
9. Global On-Premises Based Augmented Analytics Market Research And Analysis By Region, 2023-2031 ($ Million)
10. Global Cloud Based Augmented Analytics Market Research And Analysis By Region, 2023-2031 ($ Million)
11. Global Augmented Analytics Market Research And Analysis By Verticals, 2023-2031 ($ Million)
12. Global Augmented Analytics For BFSI Market Research And Analysis By Region, 2023-2031 ($ Million)
13. Global Augmented Analytics For Telecom & IT Market Research And Analysis By Region, 2023-2031 ($ Million)
14. Global Augmented Analytics For Retail & Consumer Goods Market Research And Analysis By Region, 2023-2031 ($ Million)
15. Global Augmented Analytics For Healthcare & Life Sciences Market Research And Analysis By Region, 2023-2031 ($ Million)
16. Global Augmented Analytics For Manufacturing Market Research And Analysis By Region, 2023-2031 ($ Million)
17. Global Augmented Analytics For Governments & Defense Market Research And Analysis By Region, 2023-2031 ($ Million)
18. Global Augmented Analytics For Other Verticals Market Research And Analysis By Region, 2023-2031 ($ Million
19. Global Augmented Analytics Market Research And Analysis By Region, 2023-2031 ($ Million)
20. North American Augmented Analytics Market Research And Analysis By Country, 2023-2031 ($ Million)
21. North American Augmented Analytics Market Research And Analysis By Component, 2023-2031 ($ Million)
22. North American Augmented Analytics Market Research And Analysis By Services, 2023-2031 ($ Million)
23. North American Augmented Analytics Market Research And Analysis By Deployment Mode, 2023-2031 ($ Million)
24. North American Augmented Analytics Market Research And Analysis By Verticals, 2023-2031 ($ Million)
25. European Augmented Analytics Market Research And Analysis By Country, 2023-2031 ($ Million)
26. European Augmented Analytics Market Research And Analysis By Component, 2023-2031 ($ Million)
27. European Augmented Analytics Market Research And Analysis By Services, 2023-2031 ($ Million)
28. European Augmented Analytics Market Research And Analysis By Deployment Mode, 2023-2031 ($ Million)
29. European Augmented Analytics Market Research And Analysis By Verticals, 2023-2031 ($ Million)
30. Asia-Pacific Augmented Analytics Market Research And Analysis By Country, 2023-2031 ($ Million)
31. Asia-Pacific Augmented Analytics Market Research And Analysis By Component, 2023-2031 ($ Million)
32. Asia-Pacific Augmented Analytics Market Research And Analysis By Services, 2023-2031 ($ Million)
33. Asia-Pacific Augmented Analytics Market Research And Analysis By Deployment Mode, 2023-2031 ($ Million)
34. Asia-Pacific Augmented Analytics Market Research And Analysis By Verticals, 2023-2031 ($ Million)
35. Rest Of The World Augmented Analytics Market Research And Analysis By Region, 2023-2031 ($ Million)
36. Rest Of The World Augmented Analytics Market Research And Analysis By Component, 2023-2031 ($ Million)
37. Rest Of The World Augmented Analytics Market Research And Analysis By Services, 2023-2031 ($ Million)
38. Rest Of The World Augmented Analytics Market Research And Analysis By Deployment Mode, 2023-2031 ($ Million)
39. Rest Of The World Augmented Analytics Market Research And Analysis By Verticals, 2023-2031 ($ Million)
1. Global Augmented Analytics Market Share By Component, 2023 Vs 2031 (%)
2. Global Augmented Analytics Software Market Share By Region, 2023 Vs 2031 (%)
3. Global Augmented Analytics Services Market Share By Region, 2023 Vs 2031 (%)
4. Global Augmented Analytics Market Share By Services, 2023 Vs 2031 (%)
5. Global Augmented Analytics Training and Consulting Market Share By Region, 2023 Vs 2031 (%)
6. Global Augmented Analytics Deployment and Integration Market Share By Region, 2023 Vs 2031 (%)
7. Global Augmented Analytics Support and Maintenance Market Share By Region, 2023 Vs 2031 (%)
8. Global Augmented Analytics Market Share By Deployment Mode, 2023 Vs 2031 (%)
9. Global On-Premises Based Augmented Analytics Market Share By Region, 2023 Vs 2031 (%)
10. Global Cloud-Based Augmented Analytics Market Share By Region, 2023 Vs 2031 (%)
11. Global Augmented Analytics Market Share By Verticals, 2023 Vs 2031 (%)
12. Global Augmented Analytics For BFSI Market Share By Region, 2023 Vs 2031 (%)
13. Global Augmented For Telecom & IT Analytics Market Share By Region, 2023 Vs 2031 (%)
14. Global Augmented Analytics For Retail & Consumer Goods Market Share By Region, 2023 Vs 2031 (%)
15. Global Augmented Analytics For Healthcare & Life Sciences Market Share By Region, 2023 Vs 2031 (%)
16. Global Augmented Analytics For Manufacturing Market Share By Region, 2023 Vs 2031 (%)
17. Global Augmented Analytics For Governments & Defense Market Share By Region, 2023 Vs 2031 (%)
18. Global Augmented Analytics Market Share By Region, 2023 Vs 2031 (%)
19. US Augmented Analytics Market Size, 2023-2031 ($ Million)
20. Canada Augmented Analytics Market Size, 2023-2031 ($ Million)
21. UK Augmented Analytics Market Size, 2023-2031 ($ Million)
22. France Augmented Analytics Market Size, 2023-2031 ($ Million)
23. Germany Augmented Analytics Market Size, 2023-2031 ($ Million)
24. Italy Augmented Analytics Market Size, 2023-2031 ($ Million)
25. Spain Augmented Analytics Market Size, 2023-2031 ($ Million)
26. Rest Of Europe Augmented Analytics Market Size, 2023-2031 ($ Million)
27. India Augmented Analytics Market Size, 2023-2031 ($ Million)
28. China Augmented Analytics Market Size, 2023-2031 ($ Million)
29. Japan Augmented Analytics Market Size, 2023-2031 ($ Million)
30. South Korea Augmented Analytics Market Size, 2023-2031 ($ Million)
31. Rest Of Asia-Pacific Augmented Analytics Market Size, 2023-2031 ($ Million)
32. Latin America Augmented Analytics Market Size, 2023-2031 ($ Million)
33. Middle East And Africa Augmented Analytics Market Size, 2023-2031 ($ Million)


