Connected Ship Market
Global Connected Ship Market Size, Share & Trends Analysis Report, By Ship Type (Commercial and Defense), By Application (Vessel Traffic Management, Fleet Operations, and Fleet Health Monitoring), By Installation Type (Onboard and Onshore) and Forecast, 2020-2026 Update Available - Forecast 2025-2031
The global connected ship market is estimated to grow at a CAGR of nearly 4.2% during the forecast period. The major factors contributing to the market growth include the increasing adoption of IoT solutions in the maritime industry and significant demand for maritime transportation. Increasing demand for maritime transportation has witnessed over the decades owing to the increasing global trade across the globe. More than 90% of the global trade is conducted by the sea as it is the most cost-effective way to move bulk goods and raw materials across the globe.
As per the Eurostat, in the third quarter of 2019, 880 million tons of goods were handled in the main EU ports. This leads to increasing demand for ships with digital technologies to enhance efficiency, increase productivity, and reduce carbon emissions in the marine sector. Advanced control support is required in ships which can maintain an extremely precise position when in rough waters offshore. This increases the need for Dynamic Positioning (DP) control systems that enable the position and orientation of the ship to be efficiently and safely controlled, which offers unparalleled flexibility and facilitates more energy-efficient operations.
The shipping sector is extremely complex, where a company has several vessels, with locations all across the globe, which in turn, contributes to the demand for data intelligence and insight to make more informed and smarter decisions. Therefore, the ship owners need smart ships that can support to deliver pre-emptive and predictive insights. For instance, GE offers SeaStream Insight that can offer a unique level of understanding to the ship owners into a ships’ operational state at all times. This allows the user to have confidence in the readiness of assets’ for operations.
Additionally, the smart ship offer benefits to the operators in terms of the reduction in service support costs, elimination of unnecessary maintenance checks, complete reduction in operating costs, and avoidance of unexpected downtime. The vessel can transfer the critical data safely and securely to the service hub owing to the remote monitoring capability. Even in the most remote parts all over the world, the support team can completely access the ship and provides support whenever required. The emerging focus on maritime security is expected to reinforce the integration of IoT solutions in ships, which in turn, will encourage market growth.
Market Segmentation
The global connected ship market is segmented based on ship type, application, and installation type. Based on ship type, the market is classified into commercial and defense. Based on application, the market is classified into vessel traffic management, fleet operations, and fleet health monitoring. Based on the installation, the market is classified into onboard and onshore.
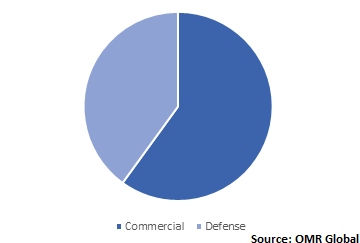
Commercial ships held the largest share in the global connected ship market
In 2019, commercial ships are anticipated to witness potential growth owing to the rising maritime transportation and rising number of commercial ships. As per the United Nations Conference on Trade and Development (UNCTAD), in January 2019, the world commercial merchant fleet reached a carrying capacity of 1.98 billion deadweight tonnage (dwt), 52 million dwt over 2018. As of January 2019, the major five ship-owning countries jointly accounted for 51% of the global fleet tonnage. Greece occupied the largest share of 18%, followed by Japan (11%), China (11%), Singapore (6%), and Hong Kong SAR (5%). Asian companies owned nearly half of the global tonnage. The growing demand for commercial merchant fleet is driving the demand for smart solutions that offer real-time situational awareness to improve safety, navigation, and efficiency of the vessel. Combining information from Automatic Identification System (AIS), radar, and cameras, allows operators to detect any vessel and verify it against a database as either a potential threat or safe.
Global Connected Ship Market Share by Ship Type, 2019 (%)

Regional Outlook
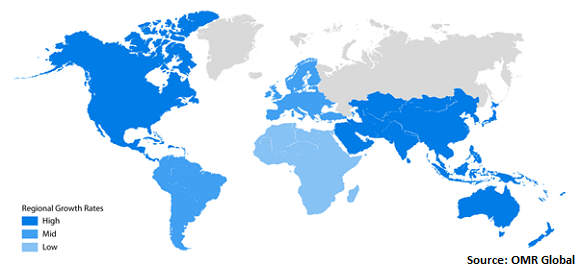
Geographically, Asia-Pacific is estimated to hold considerable share during the forecast period owing to the modernization of naval sector and emerging international trade from these countries. China is among the major manufacturers of electronic products globally, which has primarily led its global trade operations. The country exports a bulk quantity of electronic components used in televisions, smartphones, and other consumer electronics products. The major electronic components, including mobile displays, LED chips, printed circuit boards, memory, open-cell TV panels, capacitors, are imported from China. The demand for consumer electronic products globally is one of the major aspects of the increasing exports from the country. This is resulting the demand for commercial ships and the increasing China’s investment in modernizing maritime infrastructure is expected to contribute to the market growth in the region.
Global Connected Ship Market Growth, by Region 2020-2026

Market Players Outlook
The major players operating in the market include ABB Ltd., General Electric Co., Emerson Electric Co., Kongsberg Gruppen ASA, Wärtsilä Corp. The market players are focusing on strategies including mergers and acquisitions, product launches, and partnerships and collaborations, which intends to generate significant revenue by offering more advanced solutions for the shipping industry. For instance, in December 2019, ABB awarded nearly $180 million contract to deliver power, propulsion and digital solutions to Genting Hong Kong’s six ‘Universal Class’ vessels that will bring global hotel brands to sea.
The Report Covers
- Market value data analysis of 2019 and forecast to 2026.
- Annualized market revenues ($ million) for each market segment.
- Country-wise analysis of major geographical regions.
- Key companies operating in the global connected ship market. Based on the availability of data, information related to pipeline products, and relevant news is also available in the report.
- Analysis of business strategies by identifying the key market segments positioned for strong growth in the future.
- Analysis of market-entry and market expansion strategies.
- Competitive strategies by identifying ‘who-stands-where’ in the market.
1. Report Summary
1.1. Research Methods and Tools
1.2. Market Breakdown
1.2.1. By Segments
1.2.2. By Geography
2. Market Overview and Insights
2.1. Scope of the Report
2.2. Analyst Insight & Current Market Trends
2.2.1. Key Findings
2.2.2. Recommendations
2.2.3. Conclusion
3. Competitive Landscape
3.1. Company Share Analysis
3.2. Key Strategy Analysis
3.3. Key Company Analysis
3.3.1. ABB Ltd.
3.3.1.1. Overview
3.3.1.2. Financial Analysis
3.3.1.3. SWOT Analysis
3.3.1.4. Recent Developments
3.3.2. General Electric Co.
3.3.2.1. Overview
3.3.2.2. Financial Analysis
3.3.2.3. SWOT Analysis
3.3.2.4. Recent Developments
3.3.3. Emerson Electric Co.
3.3.3.1. Overview
3.3.3.2. Financial Analysis
3.3.3.3. SWOT Analysis
3.3.3.4. Recent Developments
3.3.4. Kongsberg Gruppen ASA
3.3.4.1. Overview
3.3.4.2. Financial Analysis
3.3.4.3. SWOT Analysis
3.3.4.4. Recent Developments
3.3.5. Wärtsilä Corp.
3.3.5.1. Overview
3.3.5.2. Financial Analysis
3.3.5.3. SWOT Analysis
3.3.5.4. Recent Developments
4. Market Determinants
4.1 Motivators
4.2 Restraints
4.3 Opportunities
5. Market Segmentation
5.1. Global Connected Ship Market by Ship Type
5.1.1. Commercial
5.1.2. Defense
5.2. Global Connected Ship Market by Application
5.2.1. Vessel Traffic Management
5.2.2. Fleet Operations
5.2.3. Fleet Health Monitoring
5.3. Global Connected Ship Market by Installation Type
5.3.1. Onboard
5.3.2. Onshore
6. Regional Analysis
6.1. North America
6.1.1. United States
6.1.2. Canada
6.2. Europe
6.2.1. UK
6.2.2. Germany
6.2.3. Italy
6.2.4. Spain
6.2.5. France
6.2.6. Rest of Europe
6.3. Asia-Pacific
6.3.1. China
6.3.2. India
6.3.3. Japan
6.3.4. Rest of Asia-Pacific
6.4. Rest of the World
7. Company Profiles
7.1. ABB Ltd.
7.2. Atos SE
7.3. Emerson Electric Co.
7.4. General Electric Co.
7.5. Hyundai Heavy Industries Co., Ltd. (HHI)
7.6. Inmarsat Global Ltd.
7.7. Intelsat US LLC
7.8. Iridium Communications Inc.
7.9. Kongsberg Gruppen ASA
7.10. Marlink SAS
7.11. Northrop Grumman Corp.
7.12. Pon Holdings B.V.
7.13. RH Marine Netherlands B.V.
7.14. Rockwell Automation, Inc.
7.15. Schneider Electric SE
7.16. Siemens AG
7.17. Synectics plc
7.18. Ulstein Group ASA
7.19. Ulstein Group ASA
7.20. Viasat, Inc.
7.21. Wärtsilä Corp.
1. GLOBAL CONNECTED SHIP MARKET RESEARCH AND ANALYSIS BY SHIP TYPE, 2019-2026 ($ MILLION)
2. GLOBAL CONNECTED COMMERCIAL SHIP MARKET RESEARCH AND ANALYSIS BY REGION, 2019-2026 ($ MILLION)
3. GLOBAL CONNECTED DEFENSE SHIP MARKET RESEARCH AND ANALYSIS BY REGION, 2019-2026 ($ MILLION)
4. GLOBAL CONNECTED SHIP MARKET RESEARCH AND ANALYSIS BY APPLICATION, 2019-2026 ($ MILLION)
5. GLOBAL CONNECTED SHIP FOR VESSEL TRAFFIC MANAGEMENT MARKET RESEARCH AND ANALYSIS BY REGION, 2019-2026 ($ MILLION)
6. GLOBAL CONNECTED SHIP FOR FLEET OPERATIONS MARKET RESEARCH AND ANALYSIS BY REGION, 2019-2026 ($ MILLION)
7. GLOBAL CONNECTED SHIP FOR FLEET HEALTH MONITORING MARKET RESEARCH AND ANALYSIS BY REGION, 2019-2026 ($ MILLION)
8. GLOBAL CONNECTED SHIP MARKET RESEARCH AND ANALYSIS BY INSTALLATION TYPE, 2019-2026 ($ MILLION)
9. GLOBAL ONBOARD CONNECTED SHIP MARKET RESEARCH AND ANALYSIS BY REGION, 2019-2026 ($ MILLION)
10. GLOBAL ONSHORE CONNECTED SHIP MARKET RESEARCH AND ANALYSIS BY REGION, 2019-2026 ($ MILLION)
11. GLOBAL CONNECTED SHIP MARKET RESEARCH AND ANALYSIS BY GEOGRAPHY, 2019-2026 ($ MILLION)
12. NORTH AMERICAN CONNECTED SHIP MARKET RESEARCH AND ANALYSIS BY COUNTRY, 2019-2026 ($ MILLION)
13. NORTH AMERICAN CONNECTED SHIP MARKET RESEARCH AND ANALYSIS BY SHIP TYPE, 2019-2026 ($ MILLION)
14. NORTH AMERICAN CONNECTED SHIP MARKET RESEARCH AND ANALYSIS BY APPLICATION, 2019-2026 ($ MILLION)
15. NORTH AMERICAN CONNECTED SHIP MARKET RESEARCH AND ANALYSIS BY INSTALLATION TYPE, 2019-2026 ($ MILLION)
16. EUROPEAN CONNECTED SHIP MARKET RESEARCH AND ANALYSIS BY COUNTRY, 2019-2026 ($ MILLION)
17. EUROPEAN CONNECTED SHIP MARKET RESEARCH AND ANALYSIS BY SHIP TYPE, 2019-2026 ($ MILLION)
18. EUROPEAN CONNECTED SHIP MARKET RESEARCH AND ANALYSIS BY APPLICATION, 2019-2026 ($ MILLION)
19. EUROPEAN CONNECTED SHIP MARKET RESEARCH AND ANALYSIS BY INSTALLATION TYPE, 2019-2026 ($ MILLION)
20. ASIA-PACIFIC CONNECTED SHIP MARKET RESEARCH AND ANALYSIS BY COUNTRY, 2019-2026 ($ MILLION)
21. ASIA-PACIFIC CONNECTED SHIP MARKET RESEARCH AND ANALYSIS BY SHIP TYPE, 2019-2026 ($ MILLION)
22. ASIA-PACIFIC CONNECTED SHIP MARKET RESEARCH AND ANALYSIS BY APPLICATION, 2019-2026 ($ MILLION)
23. ASIA-PACIFIC CONNECTED SHIP MARKET RESEARCH AND ANALYSIS BY INSTALLATION TYPE, 2019-2026 ($ MILLION)
24. REST OF THE WORLD CONNECTED SHIP MARKET RESEARCH AND ANALYSIS BY SHIP TYPE, 2019-2026 ($ MILLION)
25. REST OF THE WORLD CONNECTED SHIP MARKET RESEARCH AND ANALYSIS BY APPLICATION, 2019-2026 ($ MILLION)
26. REST OF THE WORLD CONNECTED SHIP MARKET RESEARCH AND ANALYSIS BY INSTALLATION TYPE, 2019-2026 ($ MILLION)
1. GLOBAL CONNECTED SHIP MARKET SHARE BY SHIP TYPE, 2019 VS 2026 (%)
2. GLOBAL CONNECTED SHIP MARKET SHARE BY APPLICATION, 2019 VS 2026 (%)
3. GLOBAL CONNECTED SHIP MARKET SHARE BY INSTALLATION TYPE, 2019 VS 2026 (%)
4. GLOBAL CONNECTED SHIP MARKET SHARE BY GEOGRAPHY, 2019 VS 2026 (%)
5. US CONNECTED SHIP MARKET SIZE, 2019-2026 ($ MILLION)
6. CANADA CONNECTED SHIP MARKET SIZE, 2019-2026 ($ MILLION)
7. UK CONNECTED SHIP MARKET SIZE, 2019-2026 ($ MILLION)
8. FRANCE CONNECTED SHIP MARKET SIZE, 2019-2026 ($ MILLION)
9. GERMANY CONNECTED SHIP MARKET SIZE, 2019-2026 ($ MILLION)
10. ITALY CONNECTED SHIP MARKET SIZE, 2019-2026 ($ MILLION)
11. SPAIN CONNECTED SHIP MARKET SIZE, 2019-2026 ($ MILLION)
12. ROE CONNECTED SHIP MARKET SIZE, 2019-2026 ($ MILLION)
13. INDIA CONNECTED SHIP MARKET SIZE, 2019-2026 ($ MILLION)
14. CHINA CONNECTED SHIP MARKET SIZE, 2019-2026 ($ MILLION)
15. JAPAN CONNECTED SHIP MARKET SIZE, 2019-2026 ($ MILLION)
16. REST OF ASIA-PACIFIC CONNECTED SHIP MARKET SIZE, 2019-2026 ($ MILLION)
17. REST OF THE WORLD CONNECTED SHIP MARKET SIZE, 2019-2026 ($ MILLION)


