Energy as a Service (EaaS) Market
Global Energy as a Service (EaaS) Market Size, Share & Trends Analysis Report, By Type (Power Generation Services, Operational and Maintenance Services, and Energy Efficiency and Optimization Services), By End-User (Commercial, Industrial, and Others) and Forecast, 2019-2025 Update Available - Forecast 2025-2035
The global Energy as a Service (EaaS) market is estimated to grow at a significant CAGR during the forecast period. The major factors contributing to the growth of the market include rising industrialization across the globe and increasing focus on reducing energy costs. As per the European Commission, buildings are accountable for nearly 36% of CO2 emissions and 40% of energy consumption in the EU. Currently, nearly 75% of the building stock in the EU is energy inefficient, nearly 35% of the buildings in the EU are more than 50 years old, while only 0.4-1.2% of the building stock is renovated annually.
Therefore, the European government is supporting energy-efficient buildings through its new rule Directive (2018/844/EU) on the energy performance of buildings, launched in July 2018 as part of the Clean Energy for All Europeans package. Such new provisions will make future buildings much comfortable and greener, which thereby will consume less energy. The new rule encourages the utilization of investments in renovation and is anticipated that SMEs will primarily benefit from renovation, as it accounts for over 70% of the value-added in the EU building sector. This, in turn, will encourage the adoption of EaaS for demand and supply management of energy.
EaaS is an advanced business model where a service provider delivers several energy-related services as compared to the only supply of electricity. With the use of distributed energy resources, automatic control systems can offer reactive power support for controlling voltage. Energy service providers can utilize remotely controlled intelligent devices for the management of consumption and decrease the load during peak demand hours. In addition, the emerging concept of a smart home is offering an opportunity for market growth. EaaS is an integrated solution that allows to monitor, automate and control energy consumption, which is beneficial for smart homes.
Market Segmentation
The global EaaS market is segmented based on the type and end-user. Based on type, the market is classified into power generation services, operational and maintenance services, and energy efficiency and optimization services. Based on end-user, the market is classified into commercial, industrial, and others.
EaaS finds its significant application in industrial segment
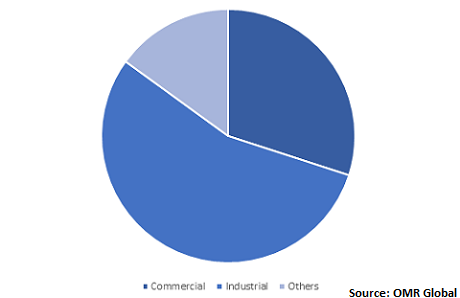
Industries are anticipated to hold a significant share in the industrial segment as it accounts for the significant consumption of energy among other end-users. For instance, as per the Energy Information Administration (EIA), the industrial sector utilizes more delivered energy rather than other end-use sectors consume as it consumes nearly 54% of the total delivered energy across the globe. As a result, industries rely on smart approaches to reduce their energy bills and manage their energy consumption efficiently. EaaS allows demand management, provides support for customers with energy storage and decentralised generation, and the exchange of electricity through advice on energy savings, local networks, and security-enhancing measures.
This, in turn, contributes to the demand for EaaS model to optimize the balance between energy demand and supply by incorporating demand management and energy efficiency services. The countries where the EaaS model has been implemented include the US, UK, Italy, China, Australia, Sweden, Finland, Japan, and Ireland. Rapid industrialization across the countries is encouraging the adoption of EaaS model to facilitate energy storage and support customers with decentralized generation. Therefore, it is an efficient model to reduce the amount of energy consumption and thereby lowers energy costs and carbon footprint.
Global EaaS Market Share by End-User, 2018 (%)

Regional Outlook
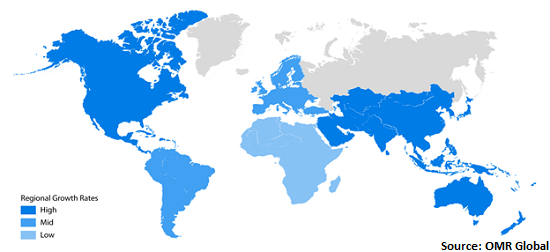
The global EaaS market is classified into North America, Europe, Asia-Pacific, and Rest of the World (RoW). Asia-Pacific is estimated to hold a significant share in the market during the forecast period owing to increasing industrialization coupled with the government initiatives to promote the manufacturing sector and rising number of commercials in the region. In May 2015, the Chinese government introduced Made in China (MIC) 2025 initiative which comprises a range of state-backed programs that aims to accelerate productivity, modernize the Chinese economy, and make innovations in industrial processes. This, in turn, may contribute to the demand for EaaS model to increase productivity while managing electricity consumption.
North America EaaS market is being significantly driven by the rising focus of end-users towards maintaining energy consumption. For instance, WGL Energy Systems (WGL Energy) offers the Resilient Energy Supply Node (RESNode), an EaaS solution which is intended to offer the US Department of Defense with considerable flexibility in securing cyber secure, highly dependable, and grid-independent electricity generation. As a result, it is being significantly adopted in commercial operations to reduce the cost of energy.
Global EaaS Market Growth, by Region 2019-2025

Market Players Outlook
Some crucial players operating in the market include Schneider Electric SE, Honeywell International Inc., Veolia Environnement SA, Enel X s.r.l., and EDF Energy. Mergers and acquisitions and partnerships and collaborations are considered as key strategies adopted by the market players to expand market share and gain a competitive advantage. For instance, in September 2019, Honeywell International declared an agreement with NRStor C&I L.P. for the introduction of Experion Energy Program. Under the agreement, both the companies will develop and operate 300 MW of renewable battery energy storage systems across the US and Canada from early 2020. As a result, this will support Honeywell to expand their energy operations in the North America.
The Report Covers
- Market value data analysis of 2018 and forecast to 2025.
- Annualized market revenues ($ million) for each market segment.
- Country-wise analysis of major geographical regions.
- Key companies operating in the global EaaS market. Based on the availability of data, information related to pipeline products, and relevant news is also available in the report.
- Analysis of business strategies by identifying the key market segments positioned for strong growth in the future.
- Analysis of market-entry and market expansion strategies.
- Competitive strategies by identifying ‘who-stands-where’ in the market.
1. Report Summary
1.1. Research Methods and Tools
1.2. Market Breakdown
1.2.1. By Segments
1.2.2. By Geography
2. Market Overview and Insights
2.1. Scope of the Report
2.2. Analyst Insight & Current Market Trends
2.2.1. Key Findings
2.2.2. Recommendations
2.2.3. Conclusion
3. Competitive Landscape
3.1. Company Share Analysis
3.2. Key Strategy Analysis
3.3. Key Company Analysis
3.3.1. Schneider Electric SE
3.3.1.1. Overview
3.3.1.2. Financial Analysis
3.3.1.3. SWOT Analysis
3.3.1.4. Recent Developments
3.3.2. Honeywell International Inc.
3.3.2.1. Overview
3.3.2.2. Financial Analysis
3.3.2.3. SWOT Analysis
3.3.2.4. Recent Developments
3.3.3. Veolia Environnement SA
3.3.3.1. Overview
3.3.3.2. Financial Analysis
3.3.3.3. SWOT Analysis
3.3.3.4. Recent Developments
3.3.4. Enel X s.r.l.
3.3.4.1. Overview
3.3.4.2. Financial Analysis
3.3.4.3. SWOT Analysis
3.3.4.4. Recent Developments
3.3.5. EDF Energy
3.3.5.1. Overview
3.3.5.2. Financial Analysis
3.3.5.3. SWOT Analysis
3.3.5.4. Recent Developments
4. Market Determinants
4.1 Motivators
4.2 Restraints
4.3 Opportunities
5. Market Segmentation
5.1. Global EaaS Market by Type
5.1.1. Power Generation Services
5.1.2. Operational and Maintenance Services
5.1.3. Energy Efficiency and Optimization Services
5.2. Global EaaS Market by End-User
5.2.1. Commercial
5.2.2. Industrial
5.2.3. Others (Government)
6. Regional Analysis
6.1. North America
6.1.1. United States
6.1.2. Canada
6.2. Europe
6.2.1. UK
6.2.2. Germany
6.2.3. Italy
6.2.4. Spain
6.2.5. France
6.2.6. Rest of Europe
6.3. Asia-Pacific
6.3.1. China
6.3.2. India
6.3.3. Japan
6.3.4. Rest of Asia-Pacific
6.4. Rest of the World
7. Company Profiles
7.1. Bernhard
7.2. Blackstone Energy Services Inc.
7.3. Carbon Lighthouse Inc.
7.4. Centrica plc
7.5. E.ON SE
7.6. EDF Trading Ltd.
7.7. Edison International
7.8. Enel X s.r.l.
7.9. Enertika
7.10. ENGIE
7.11. Entegrity
7.12. Flywheel Energy, LLC
7.13. Honeywell International Inc.
7.14. Ørsted A/S
7.15. Schneider Electric SE
7.16. Sealed Inc.
7.17. Siemens AG
7.18. Sunrun Inc.
7.19. United Technologies Corp.
7.20. Veolia Environnement SA
7.21. WGL Holdings, Inc.
1. GLOBAL EAAS MARKET RESEARCH AND ANALYSIS BY TYPE, 2018-2025 ($ MILLION)
2. GLOBAL POWER GENERATION SERVICES MARKET RESEARCH AND ANALYSIS BY REGION, 2018-2025 ($ MILLION)
3. GLOBAL OPERATIONAL AND MAINTENANCE SERVICES MARKET RESEARCH AND ANALYSIS BY REGION, 2018-2025 ($ MILLION)
4. GLOBAL ENERGY EFFICIENCY AND OPTIMIZATION SERVICES MARKET RESEARCH AND ANALYSIS BY REGION, 2018-2025 ($ MILLION)
5. GLOBAL EAAS MARKET RESEARCH AND ANALYSIS BY END-USER, 2018-2025 ($ MILLION)
6. GLOBAL EAAS IN COMMERCIAL MARKET RESEARCH AND ANALYSIS BY REGION, 2018-2025 ($ MILLION)
7. GLOBAL EAAS IN INDUSTRIAL MARKET RESEARCH AND ANALYSIS BY REGION, 2018-2025 ($ MILLION)
8. GLOBAL EAAS IN OTHER END-USERS MARKET RESEARCH AND ANALYSIS BY REGION, 2018-2025 ($ MILLION)
9. GLOBAL EAAS MARKET RESEARCH AND ANALYSIS BY GEOGRAPHY, 2018-2025 ($ MILLION)
10. NORTH AMERICAN EAAS MARKET RESEARCH AND ANALYSIS BY COUNTRY, 2018-2025 ($ MILLION)
11. NORTH AMERICAN EAAS MARKET RESEARCH AND ANALYSIS BY TYPE, 2018-2025 ($ MILLION)
12. NORTH AMERICAN EAAS MARKET RESEARCH AND ANALYSIS BY END-USER, 2018-2025 ($ MILLION)
13. EUROPEAN EAAS MARKET RESEARCH AND ANALYSIS BY COUNTRY, 2018-2025 ($ MILLION)
14. EUROPEAN EAAS MARKET RESEARCH AND ANALYSIS BY TYPE, 2018-2025 ($ MILLION)
15. EUROPEAN EAAS MARKET RESEARCH AND ANALYSIS BY END-USER, 2018-2025 ($ MILLION)
16. ASIA-PACIFIC EAAS MARKET RESEARCH AND ANALYSIS BY COUNTRY, 2018-2025 ($ MILLION)
17. ASIA-PACIFIC EAAS MARKET RESEARCH AND ANALYSIS BY TYPE, 2018-2025 ($ MILLION)
18. ASIA-PACIFIC EAAS MARKET RESEARCH AND ANALYSIS BY END-USER, 2018-2025 ($ MILLION)
19. REST OF THE WORLD EAAS MARKET RESEARCH AND ANALYSIS BY TYPE, 2018-2025 ($ MILLION)
20. REST OF THE WORLD EAAS MARKET RESEARCH AND ANALYSIS BY END-USER, 2018-2025 ($ MILLION)
1. GLOBAL EAAS MARKET SHARE BY TYPE, 2018 VS 2025 (%)
2. GLOBAL EAAS MARKET SHARE BY END-USER, 2018 VS 2025 (%)
3. GLOBAL EAAS MARKET SHARE BY GEOGRAPHY, 2018 VS 2025 (%)
4. US EAAS MARKET SIZE, 2018-2025 ($ MILLION)
5. CANADA EAAS MARKET SIZE, 2018-2025 ($ MILLION)
6. UK EAAS MARKET SIZE, 2018-2025 ($ MILLION)
7. FRANCE EAAS MARKET SIZE, 2018-2025 ($ MILLION)
8. GERMANY EAAS MARKET SIZE, 2018-2025 ($ MILLION)
9. ITALY EAAS MARKET SIZE, 2018-2025 ($ MILLION)
10. SPAIN EAAS MARKET SIZE, 2018-2025 ($ MILLION)
11. ROE EAAS MARKET SIZE, 2018-2025 ($ MILLION)
12. INDIA EAAS MARKET SIZE, 2018-2025 ($ MILLION)
13. CHINA EAAS MARKET SIZE, 2018-2025 ($ MILLION)
14. JAPAN EAAS MARKET SIZE, 2018-2025 ($ MILLION)
15. REST OF ASIA-PACIFIC EAAS MARKET SIZE, 2018-2025 ($ MILLION)
16. REST OF THE WORLD EAAS MARKET SIZE, 2018-2025 ($ MILLION)


