Hydraulic Workover Units Market
Hydraulic Workover Units Market by Application (Onshore and Offshore), by Installation Type (Skid Mounted and Trailer Mounted) – Global Industry Share, Growth, Competitive Analysis and Forecast, 2019-2025 Update Available - Forecast 2025-2035
Hydraulic workover is a well intervention technique that supports to repair both onshore and offshore wells. It involves halting the production on a producing well in order to perform well remedial operations to improve the production of hydrocarbon. This includes well finishing operations, sand screen installations, new zone perforations, isolating certain zones, and changing complete strings. Hydraulic workover units (HWOUs) can rapidly perform several workover operations, including sand cleanout from the well, repair well casings, repairing of downhole safety valves, cementing, plug mining, and tailpipe and liners installations. These are cost-effective and reliable machines in terms of the cost associated with production and exploration activities.
The major factors encouraging market growth include rising oil and gas exploration and production activities, and the shift from traditional oil drilling techniques to HWOUs. The oil & gas companies have been shifting their focus towards HWOUs and therefore entering into a contract with HWOUs service providers for well maintenance. For instance, in January 2018, Petronas selects UMW for provision of hydraulic workover units. The contract is aimed at using all or any of the five HWOUs of UMW workovers, which include UMW Gait 1, UMW Gait 2, UMW Gait 3, UMW Gait 5, and UMW Gait 6. This will support in performing the workover services, such as maintenance and remedial treatments of an oil or gas well. HWOUs can maintain well producing at optimum rates, normally at everyday operating costs, which is significantly lower as compared to the standard drilling or workover rigs. It is a cost-effective and flexible alternative to workover rigs and traditional drilling, whether it is for repairing, drilling, re-entering or completing a well. In addition, it is ideally suitable for highly demanding applications, such as high pressure, high temperature (HPHT) wells. Therefore, the adoption of HWOU is being significantly rising in onshore and offshore operations.
Segment Outlook
The global hydraulic workover unit market is segmented on the basis of application and installation type. Based on application, the market is further classified into onshore and offshore. Based on the installation type, the market is further segmented into skid mounted and trailer mounted.
Global Hydraulic Workover Units Market, By Application Analysis
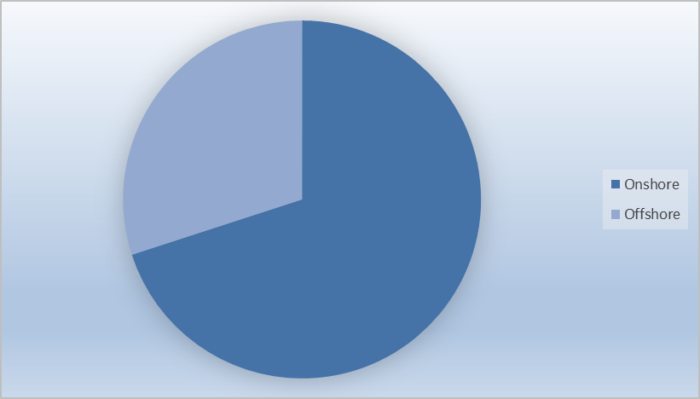
Onshore is estimated to hold the largest share in the market due to significant onshore oil production as compared to offshore oil production. For instance, as per the US Energy Information Administration (EIA), in 2015, the global onshore oil production accounted for 70% of total global oil production. A producing well might require undergoing workover procedures to widen its life and enhance its production rate. This, in turn, results in the adoption of HWOUs to extract natural resources.
Global Hydraulic Workover Units Market Share by Application, 2018 (%)

Source: OMR Global
Regional Outlook
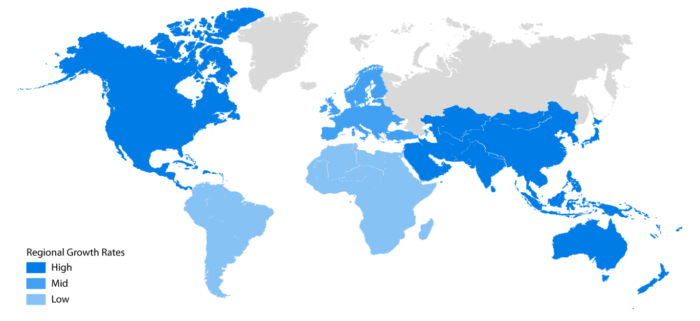
Geographically, the global hydraulic workover units market is segmented into four major regions, such as North America, Europe, Asia-Pacific, and RoW. Significant rise in oil & gas production coupled with the government initiative to enhance domestic production of oil & gas are supporting the market growth in these regions.
Global Hydraulic Workover Units Market Growth by Region, 2019-2025

Source: OMR Global
Asia-Pacific is estimated to witness lucrative growth in the market during the forecast period
Asia-Pacific is anticipated to grow significantly during the forecast period due to a significant rise in the oil & gas industry coupled with the cohesive government policies to encourage oil production. For instance, according to India Brand Equity Foundation (IBEF), India retained its spot as the third largest consumer of oil globally in 2017 with consumption of 4.69 mbpd (Thousand Barrels Per Day) of oil in 2017, compared to 4.56 mbpd in 2016. Furthermore, in September 2018, Indian Government approved fiscal incentives to attract technology and investments to improve oil field recovery, which is estimated to drive production of hydrocarbons, valued $745.82 billion over the next 20 years. In addition, the petroleum and natural gas sector attracted FDI amounted to $7 billion during April 2000 and December 2018. As the oil & gas industry is one of the major contributors to the growth of the Indian economy, the government has been significantly focusing on promoting oil & gas production activities. This, in turn, is estimated to offer significant opportunity for market growth in the region.
Competitive Landscape
The major players operating in the market include Superior Energy Services, Inc., Halliburton Energy Services, Inc., National Oilwell Varco, Inc., Canadian Energy Equipment Manufacturing FZE (CEEM), and Uzma Berhad. These companies are offering HWOUs to perform routine well maintenance for inland waters, land, and offshore installations. They are offering systems that can reduce rig up time as much as 25% as compared to a conventional workover rig. Additionally, its offerings involve safety features to offer protection against low operating pressure, power loss, mechanical failure, operator error, and obstruction.
Furthermore, some of the major strategies adopted by the companies include partnerships and collaborations, product launches, and mergers and acquisitions. For instance, in December 2017, Nabors Industries Ltd. acquired Tesco Corp., a provider of technology-based solutions for the upstream energy industry. The integration will allow Nabors to implement new levels of drilling automation and analytics. In addition, Nabors is intended to further deploy Tesco’s premium casing running tools and automation technologies globally, which in turn, will significantly contribute to the growth of its revenue.
The Report Covers
- Annualized market revenues ($ billion) for each market segment.
- Market value data analysis from 2018 to 2019 and forecast to 2025.
- Company share and market share data for global hydraulic workover units market.
- Global corporate-level profiles of key companies operating within the global hydraulic workover units market. Based on the availability of data for the category and country, information related to pipeline products, and relevant news is also available in the report.
- Analysis of business strategies by identifying the key market segments positioned for strong growth in the future.
- Analysis of market-entry and market expansion strategies.
- Competitive strategies by identifying ‘who-stands-where’ in the market.
- Investment strategies by identifying the key market segments expected to register strong growth in the near future.
- Understand the key distribution channels and identifying the most preferred mode of product distribution.
1. Report Summary
1.1. Research Methods and Tools
1.2. Market Breakdown
1.2.1. By Segments
1.2.2. By Geography
1.2.3. By Stakeholders
2. Market Overview and Insights
2.1. Scope of the Report
2.2. Analyst Insight & Current Market Trends
2.2.1. Key Findings
2.2.2. Recommendations
2.2.3. Conclusion
2.3. Rules & Regulations
3. Competitive Landscape
3.1. Competitive Dashboard
3.2. Key Strategy Analysis
3.3. Key Company Analysis
3.3.1. Superior Energy Services, Inc.
3.3.1.1. Overview
3.3.1.2. Financial Analysis
3.3.1.3. SWOT Analysis
3.3.1.4. Recent Developments
3.3.2. Halliburton Energy Services, Inc.
3.3.2.1. Overview
3.3.2.2. Financial Analysis
3.3.2.3. SWOT Analysis
3.3.2.4. Recent Developments
3.3.3. National Oilwell Varco, Inc.
3.3.3.1. Overview
3.3.3.2. Financial Analysis
3.3.3.3. SWOT Analysis
3.3.3.4. Recent Developments
3.3.4. Basic Energy Services, Inc.
3.3.4.1. Overview
3.3.4.2. Financial Analysis
3.3.4.3. SWOT Analysis
3.3.4.4. Recent Developments
3.3.5. Uzma Berhad
3.3.5.1. Overview
3.3.5.2. Financial Analysis
3.3.5.3. SWOT Analysis
3.3.5.4. Recent Developments
4. Market Determinants
4.1. Motivators
4.2. Restraints
4.3. Opportunities
5. Market Segmentation
5.1. Global Hydraulic Workover Units Market by Application
5.1.1. Onshore
5.1.2. Offshore
5.2. Global Hydraulic Workover Units Market by Installation Type
5.2.1. Skid Mounted
5.2.2. Trailer Mounted
6. Regional Analysis
6.1. North America
6.1.1. United States
6.1.2. Canada
6.2. Europe
6.2.1. UK
6.2.2. Germany
6.2.3. Italy
6.2.4. Spain
6.2.5. France
6.2.6. Rest of Europe
6.3. Asia-Pacific
6.3.1. China
6.3.2. India
6.3.3. Japan
6.3.4. Rest of Asia-Pacific
6.4. Rest of the World
7. Company Profiles
7.1. Basic Energy Services, Inc.
7.2. Canadian Energy Equipment Manufacturing FZE (CEEM)
7.3. EMAS Energy Services (Thailand) Ltd.
7.4. ESCALATE Oil Tools, LLC
7.5. Halliburton Energy Services, Inc.
7.6. High Arctic Energy Services, Inc.
7.7. ICON Engineering Pty Ltd.
7.8. Nabors Industries Ltd.
7.9. National Oilwell Varco, Inc.
7.10. Piston Well Services, Inc.
7.11. Precision Drilling Corp.
7.12. PT. Elnusa Tbk
7.13. Rigs, Derricks Etc.,LLC
7.14. Rigsmart Systems
7.15. RPC, Inc.
7.16. Superior Energy Services, Inc.
7.17. Tianjin DFXK Petroleum Machinery Co.,Ltd.
7.18. Uzma Berhad
7.19. Velesto Energy Berhad
7.20. WellGear Group B.V.
7.21. ZYT Petroleum Equipment Co., Ltd.
1. GLOBAL HYDRAULIC WORKOVER UNITS MARKET RESEARCH AND ANALYSIS BY APPLICATION, 2018-2025 ($ MILLION)
2. GLOBAL HYDRAULIC WORKOVER UNITS IN ONSHORE MARKET RESEARCH AND ANALYSIS BY REGION, 2018-2025 ($ MILLION)
3. GLOBAL HYDRAULIC WORKOVER UNITS IN OFFSHORE MARKET RESEARCH AND ANALYSIS BY REGION, 2018-2025 ($ MILLION)
4. GLOBAL HYDRAULIC WORKOVER UNITS MARKET RESEARCH AND ANALYSIS BY INSTALLATION TYPE, 2018-2025 ($ MILLION)
5. GLOBAL SKID MOUNTED HYDRAULIC WORKOVER UNITS MARKET RESEARCH AND ANALYSIS BY REGION, 2018-2025 ($ MILLION)
6. GLOBAL TRAILER MOUNTED HYDRAULIC WORKOVER UNITS MARKET RESEARCH AND ANALYSIS BY REGION, 2018-2025 ($ MILLION)
7. GLOBAL HYDRAULIC WORKOVER UNITS MARKET RESEARCH AND ANALYSIS BY GEOGRAPHY, 2018-2025 ($ MILLION)
8. NORTH AMERICAN HYDRAULIC WORKOVER UNITS MARKET RESEARCH AND ANALYSIS BY COUNTRY, 2018-2025 ($ MILLION)
9. NORTH AMERICAN HYDRAULIC WORKOVER UNITS MARKET RESEARCH AND ANALYSIS BY APPLICATION, 2018-2025 ($ MILLION)
10. NORTH AMERICAN HYDRAULIC WORKOVER UNITS MARKET RESEARCH AND ANALYSIS BY INSTALLATION TYPE, 2018-2025 ($ MILLION)
11. EUROPEAN HYDRAULIC WORKOVER UNITS MARKET RESEARCH AND ANALYSIS BY COUNTRY, 2018-2025 ($ MILLION)
12. EUROPEAN HYDRAULIC WORKOVER UNITS MARKET RESEARCH AND ANALYSIS BY APPLICATION, 2018-2025 ($ MILLION)
13. EUROPEAN HYDRAULIC WORKOVER UNITS MARKET RESEARCH AND ANALYSIS BY INSTALLATION TYPE, 2018-2025 ($ MILLION)
14. ASIA-PACIFIC HYDRAULIC WORKOVER UNITS MARKET RESEARCH AND ANALYSIS BY COUNTRY, 2018-2025 ($ MILLION)
15. ASIA-PACIFIC HYDRAULIC WORKOVER UNITS MARKET RESEARCH AND ANALYSIS BY APPLICATION, 2018-2025 ($ MILLION)
16. ASIA-PACIFIC HYDRAULIC WORKOVER UNITS MARKET RESEARCH AND ANALYSIS BY INSTALLATION TYPE, 2018-2025 ($ MILLION)
17. REST OF THE WORLD HYDRAULIC WORKOVER UNITS MARKET RESEARCH AND ANALYSIS BY APPLICATION, 2018-2025 ($ MILLION)
18. REST OF THE WORLD HYDRAULIC WORKOVER UNITS MARKET RESEARCH AND ANALYSIS BY INSTALLATION TYPE, 2018-2025 ($ MILLION)
1. GLOBAL HYDRAULIC WORKOVER UNITS MARKET SHARE BY APPLICATION, 2018 VS 2025 (%)
2. GLOBAL HYDRAULIC WORKOVER UNITS MARKET SHARE BY INSTALLATION TYPE, 2018 VS 2025 (%)
3. GLOBAL HYDRAULIC WORKOVER UNITS MARKET SHARE BY GEOGRAPHY, 2018 VS 2025 (%)
4. US HYDRAULIC WORKOVER UNITS SIZE, 2018-2025 ($ MILLION)
5. CANADA HYDRAULIC WORKOVER UNITS MARKET SIZE, 2018-2025 ($ MILLION)
6. UK HYDRAULIC WORKOVER UNITS MARKET SIZE, 2018-2025 ($ MILLION)
7. FRANCE HYDRAULIC WORKOVER UNITS MARKET SIZE, 2018-2025 ($ MILLION)
8. GERMANY HYDRAULIC WORKOVER UNITS MARKET SIZE, 2018-2025 ($ MILLION)
9. ITALY HYDRAULIC WORKOVER UNITS MARKET SIZE, 2018-2025 ($ MILLION)
10. SPAIN HYDRAULIC WORKOVER UNITS MARKET SIZE, 2018-2025 ($ MILLION)
11. ROE HYDRAULIC WORKOVER UNITS MARKET SIZE, 2018-2025 ($ MILLION)
12. INDIA HYDRAULIC WORKOVER UNITS MARKET SIZE, 2018-2025 ($ MILLION)
13. CHINA HYDRAULIC WORKOVER UNITS MARKET SIZE, 2018-2025 ($ MILLION)
14. JAPAN HYDRAULIC WORKOVER UNITS MARKET SIZE, 2018-2025 ($ MILLION)
15. REST OF ASIA-PACIFIC HYDRAULIC WORKOVER UNITS MARKET SIZE, 2018-2025 ($ MILLION)
16. REST OF THE WORLD HYDRAULIC WORKOVER UNITS MARKET SIZE, 2018-2025 ($ MILLION)


