Power Grid Market
Power Grid Market Size, Share & Trends Analysis Report by Component (Cables, Variables Speed Drives, Transformers, and Switchgear) by Power Source (Conventional power, Renewable power, Nuclear power, and Hybrid power) and by Application (Generation, Transmission, and Distribution) Forecast Period (2024-2031)
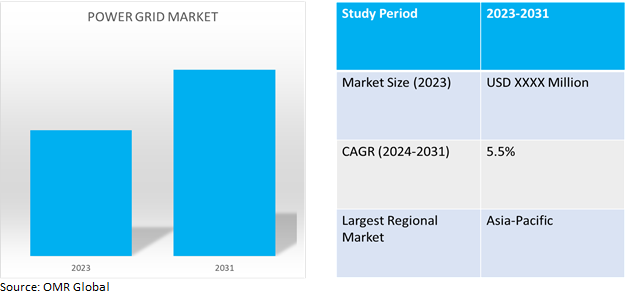
Power grid market is anticipated to grow at a moderate CAGR of 5.5% during the forecast period (2024-2031). Power grids are used to deliver electricity from power plants to houses and businesses across the country. It is at the core of any nation to transport electricity throughout the nation, which is enabled by power grid companies and infrastructure. It is a vast network of power generation, transmission, and delivery with proper power management for consumers consisting of infrastructure such as power stations, transmission lines, and distribution lines.

Market Dynamics
Rising Electricity Consumption Globally
The power grid industry has seen a positive upward trend owing to rising electricity consumption, which is contributed by the increasing population, expansion of electricity infrastructure in remote locations, increasing usage of electronic devices, and rapid urbanization. For instance, according to World Energy Outlook Report 2022 by International Energy Agency (IEA), global electricity demand rises by 5,900 terawatt-hours (TWh) in the Stated Policies Scenario (STEPS) and over 7,000 TWh in the Announced Pledges Scenario (APS) by 2030, equivalent to adding the current level of demand in the US and the EU. In advanced economies, transport is the largest contributor to increased electricity demand as the market share of electric cars rises from about 8.0% in 2021 to 32.0% in the STEPS and almost 50.0% in the APS by 2030. In emerging markets and developing economies, population growth and rising demand for cooling contribute to increasing electricity demand. In China, air conditioner ownership will expand by around 40.0% from current levels in the STEPS and APS by 2030.
Increasing Investments to develop Transmission and Distribution Infrastructure
To meet rising electricity demand, governments are investing in electricity infrastructure including transmission and distribution infrastructure to strengthen rural electricity networks as well as provide better electricity transmission to urban areas. For instance, according to IEA estimates around $2.8 trillion were anticipated to be invested in energy in 2023. More than $1.7 trillion is going to clean energy, including renewable power, nuclear, grids, storage, low-emission fuels, efficiency improvements, and end-use renewables and electrification. The remainder, slightly over $1.0 trillion, is going to unabated fossil fuel supply and power, of which around 15.0% is to coal and the rest to oil and gas.
Market Segmentation
Our in-depth analysis of the global power grid market includes the following segments by component, power source, and application:
- Based on components, the market is sub-segmented into cables, variable speed drives, transformers, and switchgear.
- Based on power sources, the market is sub-segmented into conventional power, renewable power, nuclear power, and hybrid power.
- Based on application, the market is sub-segmented into generation, transmission, and distribution
Cables to remain as the Largest Segment
Based on the component type, the power grid cables sub-segment is expected to hold the largest share of the market. The primary factors supporting the segments are advancements in cable technology, increasing demand for reliable and secure power transmission, and cable requirement at large scale for electricity distribution.
Conventional Power source is still the largest sub-segment
The majority of global electricity is still powered by conventional power sources owing to the developed infrastructure, comparative cost-benefit, and high reliability of the source. As renewable energy sources are growing, coal and gas still dominate the market due to their wide availability and supply with the possibility of being reduced over coming years due to advancement in renewable infrastructure and rapid adaptability of renewable sources by governments. As per IEA, coal still supplies just over a third of global electricity generation even though it is the most carbon-intensive fossil fuel. While coal is being gradually replaced in most countries for power generation.
Distribution to be the Top Application
The distribution of electricity is a significant contributor into power grid application, as electricity demand rises and the development of alternative power sources remains positive, investment in distribution is rising to electrify businesses and remote areas globally. In the coming future, distribution of electricity will be the major focus of many countries. For instance, as per the Indian Investment Grid, there are currently 258 opportunities worth $26.6 billion in the Indian electricity distribution sector.
Regional Outlook
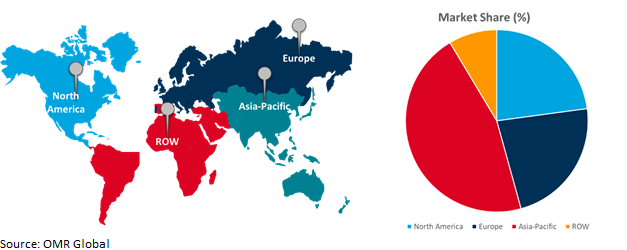
The global power grid market is further segmented based on geography including North America (the US, and Canada), Europe (UK, Italy, Spain, Germany, France, and the Rest of Europe), Asia-Pacific (India, China, Japan, South Korea, and Rest of Asia-Pacific), and the Rest of the World (the Middle East & Africa, and Latin America).
Global Power Grid Market Growth by Region 2024-2031

Asia-Pacific to Dominate Global Power Grid Market
Asia-Pacific is the biggest hub for energy generation and consumption globally. The region is expected to thrive over the coming years with the largest share currently owing to ample investments in renewable energy, development of power grid infrastructure, growing economies, and population. The four largest non-organization for Economic Cooperation and Development (OECD) electricity consumers in 2019 were China, India, Russia Federation and Brazil, representing 39.8% of global consumption. Among these countries, China has the largest share, accounting for almost half (49.5%) of non-OECD consumption. With China on top, India on third, and Japan on fourth globally, Asia contributes majorly to world energy demands. Also, it is one of the major investors in power generation through various sources. For instance, India’s installed non-fossil fuel capacity has increased 396.0% in the last 8.5 years and stands at more than 179.6 GW (including large Hydro and nuclear), about 42.0% of the country’s total capacity (as of Nov 2023). India saw the highest year-on-year growth in renewable energy additions of 9.8% in 2022. The installed solar energy capacity has increased by 30 times in the last 9 years and stands at 74.3 GW as of Jan 2024.
Market Players Outlook

*Note: Major Players Sorted in No Particular Order.
The major companies serving the global Power Grid market include ABB Ltd., Schneider Electric Industries SAS, Siemens AG, General Electric Co., and Hitachi Energy Ltd., among others. The market players are increasingly focusing on business expansion and product development by applying strategies such as collaborations, mergers, and acquisitions to stay competitive in the market. For instance, in April 2024, ABB announced a minority investment in Grid Beyond, a premier technology company that offers energy management solutions based on artificial intelligence and data science, allowing our clients to optimize distributed energy resources and industrial loads. The investment was made via ABB Ventures. This newly created strategic collaboration will contribute to the continuous expansion of ABB's sustainability advisory services offering, assisting clients and operators in utilities, industry, infrastructure, and transportation in their transition to net zero.
The Report Covers
- Market value data analysis of 2023 and forecast to 2031.
- Annualized market revenues ($ million) for each market segment.
- Country-wise analysis of major geographical regions.
- Key companies operating in the global power grid market. Based on the availability of data, information related to new product launches, and relevant news is also available in the report.
- Analysis of business strategies by identifying the key market segments positioned for strong growth in the future.
- Analysis of market-entry and market expansion strategies.
- Competitive strategies by identifying ‘who-stands-where’ in the market.
1. Report Summary
• Current Industry Analysis and Growth Potential Outlook
1.1. Research Methods and Tools
1.2. Market Breakdown
1.2.1. By Segments
1.2.2. By Region
2. Market Overview and Insights
2.1. Scope of the Report
2.2. Analyst Insight & Current Market Trends
2.2.1. Key Findings
2.2.2. Recommendations
2.2.3. Conclusion
3. Competitive Landscape
3.1. Key Company Analysis
3.2. ABB Ltd.
3.2.1. Overview
3.2.2. Financial Analysis
3.2.3. SWOT Analysis
3.2.4. Recent Developments
3.3. General Electric Co.
3.3.1. Overview
3.3.2. Financial Analysis
3.3.3. SWOT Analysis
3.3.4. Recent Developments
3.4. Hitachi Energy Ltd.
3.4.1. Overview
3.4.2. Financial Analysis
3.4.3. SWOT Analysis
3.4.4. Recent Developments
3.5. Schneider Electric Industries SAS
3.5.1. Overview
3.5.2. Financial Analysis
3.5.3. SWOT Analysis
3.5.4. Recent Developments
3.6. Siemens AG
3.6.1. Overview
3.6.2. Financial Analysis
3.6.3. SWOT Analysis
3.6.4. Recent Developments
3.7. Key Strategy Analysis
4. Market Segmentation
4.1. Global Power Grid Market by Component
4.1.1. Cables
4.1.2. Variables Speed drives
4.1.3. Transformers
4.1.4. Switchgear
4.2. Global Power Grid Market by Power Source
4.2.1. Conventional Power
4.2.2. Renewable Power
4.2.3. Nuclear Power
4.2.4. Hybrid Power
4.3. Global Power Grid Market by Application
4.3.1. Generation
4.3.2. Transmission
4.3.3. Distribution
5. Regional Analysis
5.1. North America
5.1.1. United States
5.1.2. Canada
5.2. Europe
5.2.1. UK
5.2.2. Germany
5.2.3. Italy
5.2.4. Spain
5.2.5. France
5.2.6. Rest of Europe
5.3. Asia-Pacific
5.3.1. China
5.3.2. India
5.3.3. Japan
5.3.4. South Korea
5.3.5. Rest of Asia-Pacific
5.4. Rest of the World
5.4.1. Latin America
5.4.2. Middle East and Africa
6. Company Profiles
6.1. Eaton Corp
6.2. Fuji Electric Co. Ltd.
6.3. Havells India Ltd.
6.4. Hubbell Inc.
6.5. LS ELECTRIC Co. Ltd
6.6. Mitsubishi Electric Corp.
6.7. NR Electric Co., Ltd.
6.8. NKT AS
6.9. Powell Industries, Inc.
6.10. Prysmian S.p.A
6.11. Rockwell Automation Inc.
6.12. Sécheron SA
6.13. Southwire Company, LLC
6.14. Sumitomo Electric Co. Ltd.
6.15. Toshiba Energy Systems & Solutions Corp
1. GLOBAL POWER GRID MARKET RESEARCH AND ANALYSIS BY COMPONENT, 2023-2031 ($ MILLION)
2. GLOBAL POWER GRID CABLES MARKET RESEARCH AND ANALYSIS BY REGION, 2023-2031 ($ MILLION)
3. GLOBAL POWER GRID VARIABLES SPEED DRIVES MARKET RESEARCH AND ANALYSIS BY REGION, 2023-2031 ($ MILLION)
4. GLOBAL POWER GRID TRANSFORMERS MARKET RESEARCH AND ANALYSIS BY REGION, 2023-2031 ($ MILLION)
5. GLOBAL POWER GRID SWITCHGEAR MARKET RESEARCH AND ANALYSIS BY REGION, 2023-2031 ($ MILLION)
6. GLOBAL POWER GRID MARKET RESEARCH AND ANALYSIS BY POWER SOURCE, 2023-2031 ($ MILLION)
7. GLOBAL POWER GRID FOR CONVENTIONAL POWER MARKET RESEARCH AND ANALYSIS BY REGION, 2023-2031 ($ MILLION)
8. GLOBAL POWER GRID FOR RENEWABLE POWER MARKET RESEARCH AND ANALYSIS BY REGION, 2023-2031 ($ MILLION)
9. GLOBAL POWER GRID FOR NUCLEAR POWER MARKET RESEARCH AND ANALYSIS BY REGION, 2023-2031 ($ MILLION)
10. GLOBAL POWER GRID FOR HYBRID POWER MARKET RESEARCH AND ANALYSIS BY REGION, 2023-2031 ($ MILLION)
11. GLOBAL POWER GRID MARKET RESEARCH AND ANALYSIS BY APPLICATION, 2023-2031 ($ MILLION)
12. GLOBAL POWER GRID IN POWER GENERATION MARKET RESEARCH AND ANALYSIS BY REGION, 2023-2031 ($ MILLION)
13. GLOBAL POWER GRID IN POWER TRANSMISSION MARKET RESEARCH AND ANALYSIS BY REGION, 2023-2031 ($ MILLION)
14. GLOBAL POWER GRID IN POWER DISTRIBUTION MARKET RESEARCH AND ANALYSIS BY REGION, 2023-2031 ($ MILLION)
15. GLOBAL POWER GRID MARKET RESEARCH AND ANALYSIS BY REGION, 2023-2031 ($ MILLION)
16. NORTH AMERICAN POWER GRID MARKET RESEARCH AND ANALYSIS BY COUNTRY, 2023-2031 ($ MILLION)
17. NORTH AMERICAN POWER GRID MARKET RESEARCH AND ANALYSIS BY COMPONENT, 2023-2031 ($ MILLION)
18. NORTH AMERICAN POWER GRID MARKET RESEARCH AND ANALYSIS BY POWER SOURCE, 2023-2031 ($ MILLION)
19. NORTH AMERICAN POWER GRID MARKET RESEARCH AND ANALYSIS BY APPLICATION, 2023-2031 ($ MILLION)
20. EUROPEAN POWER GRID MARKET RESEARCH AND ANALYSIS BY COUNTRY, 2023-2031 ($ MILLION)
21. EUROPEAN POWER GRID MARKET RESEARCH AND ANALYSIS BY COMPONENT, 2023-2031 ($ MILLION)
22. EUROPEAN POWER GRID MARKET RESEARCH AND ANALYSIS BY POWER SOURCE, 2023-2031 ($ MILLION)
23. EUROPEAN POWER GRID MARKET RESEARCH AND ANALYSIS BY APPLICATION, 2023-2031 ($ MILLION)
24. ASIA-PACIFIC POWER GRID MARKET RESEARCH AND ANALYSIS BY COUNTRY, 2023-2031 ($ MILLION)
25. ASIA-PACIFIC POWER GRID MARKET RESEARCH AND ANALYSIS BY COMPONENT, 2023-2031 ($ MILLION)
26. ASIA-PACIFIC POWER GRID MARKET RESEARCH AND ANALYSIS BY POWER SOURCE, 2023-2031 ($ MILLION)
27. ASIA-PACIFIC POWER GRID MARKET RESEARCH AND ANALYSIS BY APPLICATION, 2023-2031 ($ MILLION)
28. REST OF THE WORLD POWER GRID MARKET RESEARCH AND ANALYSIS BY REGION, 2023-2031 ($ MILLION)
29. REST OF THE WORLD POWER GRID MARKET RESEARCH AND ANALYSIS BY COMPONENT, 2023-2031 ($ MILLION)
30. REST OF THE WORLD POWER GRID MARKET RESEARCH AND ANALYSIS BY POWER SOURCE, 2023-2031 ($ MILLION)
31. REST OF THE WORLD POWER GRID MARKET RESEARCH AND ANALYSIS BY APPLICATION, 2023-2031 ($ MILLION)
1. GLOBAL POWER GRID MARKET SHARE BY COMPONENT, 2023 VS 2031 (%)
2. GLOBAL POWER GRID CABLES MARKET SHARE BY REGION, 2023 VS 2031 (%)
3. GLOBAL POWER GRID VARIABLES SPEED DRIVES MARKET SHARE BY REGION, 2023 VS 2031 (%)
4. GLOBAL POWER GRID TRANSFORMERS MARKET SHARE BY REGION, 2023 VS 2031 (%)
5. GLOBAL POWER GRID SWITCHGEAR MARKET SHARE BY REGION, 2023 VS 2031 (%)
6. GLOBAL POWER GRID MARKET SHARE BY POWER SOURCE, 2023 VS 2031 (%)
7. GLOBAL POWER GRID FOR CONVENTIONAL POWER MARKET SHARE BY REGION, 2023 VS 2031 (%)
8. GLOBAL POWER GRID FOR RENEWABLE POWER MARKET SHARE BY REGION, 2023 VS 2031 (%)
9. GLOBAL POWER GRID FOR NUCLEAR POWER MARKET SHARE BY REGION, 2023 VS 2031 (%)
10. GLOBAL POWER GRID FOR HYBRID POWER MARKET SHARE BY REGION, 2023 VS 2031 (%)
11. GLOBAL POWER GRID MARKET SHARE BY APPLICATION, 2023 VS 2031 (%)
12. GLOBAL POWER GRID IN POWER GENERATION MARKET SHARE BY REGION, 2023 VS 2031 (%)
13. GLOBAL POWER GRID IN POWER TRANSMISSION MARKET SHARE BY REGION, 2023 VS 2031 (%)
14. GLOBAL POWER GRID IN POWER DISTRIBUTION MARKET SHARE BY REGION, 2023 VS 2031 (%)
15. GLOBAL POWER GRID MARKET SHARE BY REGION, 2023 VS 2031 (%)
16. US POWER GRID MARKET SIZE, 2023-2031 ($ MILLION)
17. CANADA POWER GRID MARKET SIZE, 2023-2031 ($ MILLION)
18. UK POWER GRID MARKET SIZE, 2023-2031 ($ MILLION)
19. FRANCE POWER GRID MARKET SIZE, 2023-2031 ($ MILLION)
20. GERMANY POWER GRID MARKET SIZE, 2023-2031 ($ MILLION)
21. ITALY POWER GRID MARKET SIZE, 2023-2031 ($ MILLION)
22. SPAIN POWER GRID MARKET SIZE, 2023-2031 ($ MILLION)
23. REST OF EUROPE POWER GRID MARKET SIZE, 2023-2031 ($ MILLION)
24. INDIA POWER GRID MARKET SIZE, 2023-2031 ($ MILLION)
25. CHINA POWER GRID MARKET SIZE, 2023-2031 ($ MILLION)
26. JAPAN POWER GRID MARKET SIZE, 2023-2031 ($ MILLION)
27. SOUTH KOREA POWER GRID MARKET SIZE, 2023-2031 ($ MILLION)
28. REST OF ASIA-PACIFIC POWER GRID MARKET SIZE, 2023-2031 ($ MILLION)
29. LATIN AMERICA POWER GRID MARKET SIZE, 2023-2031 ($ MILLION)
30. THE MIDDLE EAST AND AFRICA POWER GRID MARKET SIZE, 2023-2031 ($ MILLION)


