Power Rental Market
Power Rental Market Size, Share & Trends Analysis Report by End User (Telecom and Data Center, Oil & Gas, Utilities, Manufacturing, Mining, and Construction, Others), by Power Rating UP TO 50 kW, 51 –500 kW, 501 –2,500 kW, and Above 2,500 kW), by Fuel (Diesel, and Gas), and by Application (Standby, Power Sharing, and Prime/Continuous). Forecast Period (2024-2031)
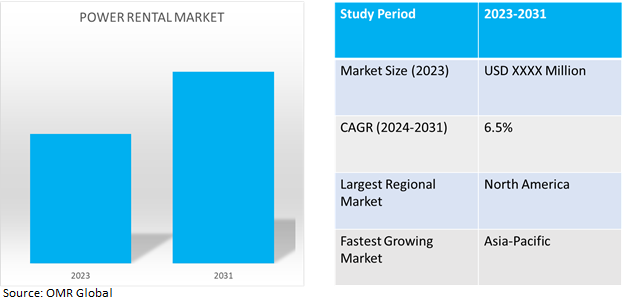
Power rental market is anticipated to grow at a CAGR of 6.5% during the forecast period (2024-2031). The power Rental or power hiring market comprises renting power equipment over purchase due to initial cost-benefit and low to no maintenance cost. Most industries prefer to rent power equipment due to flexibility in power rating, lack of power grid infrastructure, and high availability of rental equipment, specifically the mining industry based on their remote location of servicing. Other utilities include fulfilling demand on peak power load, temporary power requirement, weak power supply, generator maintenance, and others.

Market Dynamics
Rising Electrification and Power Demand
The growth in the power rental market is driven by rising electrification and power demand specifically in growing economies due to increasing investment in infrastructure development and rapid urbanization. Also, a trend to electrify industrial processes attributed to several country's net-zero goals has stimulated the demand. For instance, according to the International Energy Agency, global electricity demand is expected to rise at a faster rate over the next three years, growing by an average of 3.4% annually through 2026. The gains will be driven by an improving economic outlook, which will contribute to faster electricity demand growth both in advanced and emerging economies. Particularly in advanced economies and China, electricity demand will be supported by the ongoing electrification of the residential and transport sectors, as well as a notable expansion of the data center sector. The share of electricity in final energy consumption is estimated to have reached 20.0% in 2023, up from 18.0% in 2015.
Growth in Mining and Construction Industry
The sector remains the biggest consumer of power rental services attributed to the remote location of servicing and lack of constant power supply. Whereas, the industry has substantially grown in developing economies contributed by increased infrastructure development, urbanization, industrial production, and rising demand by the power and cement sector. For instance, according to IBEF India, important minerals showed positive growth during September 2023 over September 2022 including Manganese Ore (51.5%), Gold (22.8%), Iron Ore (17%), Coal (16%), Limestone (13.7%), Natural gas (U) (6.6%), Lignite (6.2%) Bauxite (3.5%), Zinc Conc. (1.6%), Chromite (1.6%), Copper Conc. (0.2%). Also, in the budget 2023-24, capital investment outlay for infrastructure was increased by 33.0% to $122.0 billion, which would be 3.3% of GDP. The infrastructure finance secretariat was established to enhance opportunities for private investment in infrastructure that will assist all stakeholders in more private investment in infrastructure.
Segmental Outlook
Our in-depth analysis of the global power rental market includes the following segments by end user, application, power rating and fuel.
- Based on end-user, the market is sub-segmented into telecom and data center, oil & gas, utilities, manufacturing, mining and construction, and others.
- Based on power rating, the market is sub-segmented into up to 50 kW, 51 –500 kW, 501 –2,500 kW, and above 2,500 kW.
- Based on fuel, the market is sub-segmented into diesel and gas.
- Based on application, the market is sub-segmented into standby, power sharing, and prime/continuous.
Mining and Constructions to Emerge as a Biggest End-User
Among power rental end users, the wireless charging connectors sub-segment is expected to emerge as the biggest end-user attributed to growing infrastructure, increasing urbanization, and electrification. Most servicing location for the sub-segment requires constant power sourcing with high power ratings, as their servicing locations are remote with weak power supplies. Thus, the sub-segment constantly demands and depends upon the power rental industry for its energy requirements.
501 To 2,500 Kw is a Prominent Sub-Segment in Power Rating
Generators ranging in capacity from 501 to 2,500 KW can be utilized to provide standby power as well as continuous power delivery during outages or peak shaving. Furthermore, developing countries experience more frequent power disruptions than developed nations. This is owing to inadequate transmission and distribution infrastructure, as well as outdated power plants. To ensure that electricity is simply and dependably accessible to all industries, utility-scale power-producing plants have been established in some sections on a rental basis, which is pushing the market.
Diesel Leads the Fuel Sub-Segment
Diesel generators are heavily selected by key participants in mining, oil and gas, and manufacturing industries. The abundance of diesel fuel and its low cost are two major reasons for the great demand for diesel generator sets to meet temporary power needs. Furthermore, regions like Latin America, Asia Pacific, and Africa have inadequate infrastructure for gas and liquefied petroleum gas pipelines, contributing to an increase in demand for diesel generators in these areas.
Prime/Continuous Sub-Segment Has Biggest Market
The continuous power category dominated the market among the application segment, as power rental systems are increasingly being used in the oil and gas, construction, and mining sectors requiring continual supply of electricity due to their remote servicing areas. Another factor stimulating continuous power demand is infrastructure development in countries with weak power grid infrastructure such as Brazil, Africa, and others, making continuous power supply and significant sub-segment.
Regional Outlook
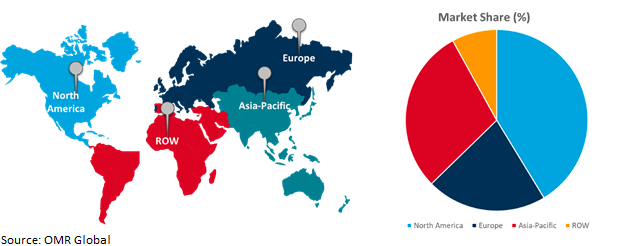
The global power rental market is further segmented based on geography including North America (the US, and Canada), Europe (UK, Italy, Spain, Germany, France, and the Rest of Europe), Asia-Pacific (India, China, Japan, South Korea, and Rest of Asia), and the Rest of the World (the Middle East & Africa, and Latin America).
North America Holds Highest Share in Global Power Rental Market
North America holds the highest share of the global power rental market share. The key factors contributing to the growth are investments in the mining and construction industry, expansion in telecommunication and data center industry, and regional initiative for net zero emission by 2050 promoting electrification, For instance, in February 2023, according to the 28th annual USGS mineral commodity summaries report. US mines produced approximately $98.2 billion in nonfuel mineral commodities in 2022, an estimated $3.6-billion increase over the 2021 revised total of $94.6 billion. Whereas the estimated value of US production of all industrial minerals in 2022 was $63.5 billion, which is about 65.0% of the total value of US mine production value making it 100.0% net import reliant for 12 of 50 listed critical minerals and more than 50.0% net import reliant for an additional 31 critical mineral commodities including 14 lanthanides, which are listed under rare earths.
Global Power Rental Market Growth by Region 2024-2031

Asia-Pacific is the fastest growing power rental market
- The Asia-Pacific region is one of the biggest power-consuming regions, driven by factors such as growing urbanization, increasing population, and rising investment in infrastructure.
- Asia-Pacific country's power demand is estimated to increase as per International Energy Agency (EA) in the next 3-5 years specifically in India and China supported by ongoing electrification of the residential and transport sectors, expansion of the data center sector, and growth in the mining sector.
Market Players Outlook

*Note: Major Players Sorted in No Particular Order.
The major companies serving the global power rental market are Aggreko Ltd, United Rentals Inc., Atlas Copco AB, Cummins Inc., and Caterpillar among others. With growing demand, market players are focusing on capitalizing on growth by adopting strategies such as collaboration, partnerships, and market expansion among others. For instance, in December 2021, United Rentals, Inc. announced its acquisition of the assets of Ahern Rentals, Inc. for approximately $2.0 billion in cash. The transaction and related expenses were funded through a combination of newly issued senior secured notes and existing capacity under the company’s ABL facility. The transaction adds approximately 2,100 employees, 60,000 rental assets, and 106 locations to United Rentals in the US and makes the company’s specialty rental solutions available to thousands of new construction and industrial customers.
The Report Covers
- Market value data analysis of 2023 and forecast to 2031.
- Annualized market revenues ($ million) for each market segment.
- Country-wise analysis of major geographical regions.
- Key companies operating in the global power rental market. Based on the availability of data, information related to new product launches, and relevant news is also available in the report.
- Analysis of business strategies by identifying the key market segments positioned for strong growth in the future.
- Analysis of market-entry and market expansion strategies.
- Competitive strategies by identifying ‘who-stands-where’ in the market.
1. Report Summary
• Current Industry Analysis and Growth Potential Outlook
1.1. Research Methods and Tools
1.2. Market Breakdown
1.2.1. By Segments
1.2.2. By Region
2. Market Overview and Insights
2.1. Scope of the Report
2.2. Analyst Insight & Current Market Trends
2.2.1. Key Findings
2.2.2. Recommendations
2.2.3. Conclusion
3. Competitive Landscape
3.1. Key Company Analysis
3.2. Aggreko Ltd
3.2.1. Overview
3.2.2. Financial Analysis
3.2.3. SWOT Analysis
3.2.4. Recent Developments
3.3. United Rentals Inc.
3.3.1. Overview
3.3.2. Financial Analysis
3.3.3. SWOT Analysis
3.3.4. Recent Developments
3.4. Atlas Copco AB
3.4.1. Overview
3.4.2. Financial Analysis
3.4.3. SWOT Analysis
3.4.4. Recent Developments
3.5. Cummins Inc.
3.5.1. Overview
3.5.2. Financial Analysis
3.5.3. SWOT Analysis
3.5.4. Recent Developments
3.6. Caterpillar
3.6.1. Overview
3.6.2. Financial Analysis
3.6.3. SWOT Analysis
3.6.4. Recent Developments
3.7. Key Strategy Analysis
4. Market Segmentation
4.1. Global Power Rental Market by End User
4.1.1. Telecom and Data Center
4.1.2. Oil & Gas
4.1.3. Utilities
4.1.4. Manufacturing
4.1.5. Mining and Construction
4.1.6. Others (Offshore, Healthcare, Marine)
4.2. Global Power Rental Market by Power Rating
4.2.1. Up to 50 kW
4.2.2. 51 –500 kW
4.2.3. 501 –2,500 kW
4.2.4. Above 2,500 kW
4.3. Global Power Rental Market by Fuel
4.3.1. Diesel
4.3.2. Gas
4.4. Global Power Rental Market by Application
4.4.1. Standby
4.4.2. Peak Shaving
4.4.3. Prime/Continuous
5. Regional Analysis
5.1. North America
5.1.1. United States
5.1.2. Canada
5.2. Europe
5.2.1. UK
5.2.2. Germany
5.2.3. Italy
5.2.4. Spain
5.2.5. France
5.2.6. Rest of Europe
5.3. Asia-Pacific
5.3.1. China
5.3.2. India
5.3.3. Japan
5.3.4. South Korea
5.3.5. Rest of Asia-Pacific
5.4. Rest of the World
5.4.1. Latin America
5.4.2. The Middle East & Africa
6. Company Profiles
6.1. Generac Power Systems, Inc.
6.2. Kohler-SDMO
6.3. Ashtead Group plc
6.4. Herc Rentals Inc.
6.5. Sudhir Power Ltd.
6.6. Wagner Equipment Co.
6.7. Shenton Group
6.8. Bredenoord
6.9. Al Faris Group
6.10. HIMOINSA S.L.
6.11. Modern Hiring Service
6.12. Wärtsilä Corp.
6.13. APR Energy
6.14. Perennial Technologies
6.15. Perfect Hiring Services
1. GLOBAL POWER RENTAL MARKET RESEARCH AND ANALYSIS BY END USER, 2023-2031 ($ MILLION)
2. GLOBAL POWER RENTAL MARKET RESEARCH AND ANALYSIS FOR TELECOM AND DATA CENTER BY REGION, 2023-2031 ($ MILLION)
3. GLOBAL POWER RENTAL MARKET RESEARCH AND ANALYSIS FOR OIL & GAS BY REGION, 2023-2031 ($ MILLION)
4. GLOBAL POWER RENTAL MARKET RESEARCH AND ANALYSIS FOR UTILITIES BY REGION, 2023-2031 ($ MILLION)
5. GLOBAL POWER RENTAL MARKET RESEARCH AND ANALYSIS FOR MANUFACTURING BY REGION, 2023-2031 ($ MILLION)
6. GLOBAL POWER RENTAL MARKET RESEARCH AND ANALYSIS FOR MINING AND CONSTRUCTION BY REGION, 2023-2031 ($ MILLION)
7. GLOBAL POWER RENTAL MARKET RESEARCH AND ANALYSIS FOR OTHER END USERS BY REGION, 2023-2031 ($ MILLION)
8. GLOBAL POWER RENTAL MARKET RESEARCH AND ANALYSIS BY POWER RATING, 2023-2031 ($ MILLION)
9. GLOBAL POWER RENTAL MARKET RESEARCH AND ANALYSIS UP TO 50 KW BY REGION, 2023-2031 ($ MILLION)
10. GLOBAL POWER RENTAL MARKET RESEARCH AND ANALYSIS BETWEEN 51 –500 kW BY REGION, 2023-2031 ($ MILLION)S
11. GLOBAL POWER RENTAL MARKET RESEARCH AND ANALYSIS BETWEEN 501 –2,500 KW BY REGION, 2023-2031 ($ MILLION)
12. GLOBAL POWER RENTAL MARKET RESEARCH AND ANALYSIS ABOVE 2,500 kW BY REGION, 2023-2031 ($ MILLION)
13. GLOBAL POWER RENTAL MARKET RESEARCH AND ANALYSIS BY FUEL, 2023-2031 ($ MILLION)
14. GLOBAL POWER RENTAL MARKET RESEARCH AND ANALYSIS FOR DIESEL BY REGION, 2023-2031 ($ MILLION)
15. GLOBAL POWER RENTAL MARKET RESEARCH AND ANALYSIS FOR GAS BY REGION, 2023-2031 ($ MILLION)
16. GLOBAL POWER RENTAL MARKET RESEARCH AND ANALYSIS BY APPLICATION, 2023-2031 ($ MILLION)
17. GLOBAL STANDBY POWER RENTAL MARKET RESEARCH AND ANALYSIS BY REGION, 2023-2031 ($ MILLION)
18. GLOBAL PEAK SHAVING POWER RENTAL MARKET RESEARCH AND ANALYSIS BY REGION, 2023-2031 ($ MILLION)
19. GLOBAL PRIME/CONTINUOUS POWER RENTAL MARKET RESEARCH AND ANALYSIS BY REGION, 2023-2031 ($ MILLION)
20. GLOBAL POWER RENTAL MARKET RESEARCH AND ANALYSIS BY REGION, 2023-2031 ($ MILLION)
21. NORTH AMERICAN POWER RENTAL MARKET RESEARCH AND ANALYSIS BY COUNTRY, 2023-2031 ($ MILLION)
22. NORTH AMERICAN POWER RENTAL MARKET RESEARCH AND ANALYSIS BY END USER, 2023-2031 ($ MILLION)
23. NORTH AMERICAN POWER RENTAL MARKET RESEARCH AND ANALYSIS BY POWER RATING, 2023-2031 ($ MILLION)
24. NORTH AMERICAN POWER RENTAL MARKET RESEARCH AND ANALYSIS BY FUEL, 2023-2031 ($ MILLION)
25. NORTH AMERICAN POWER RENTAL MARKET RESEARCH AND ANALYSIS BY APPLICATION, 2023-2031 ($ MILLION)
26. EUROPEAN POWER RENTAL MARKET RESEARCH AND ANALYSIS BY COUNTRY, 2023-2031 ($ MILLION)
27. EUROPEAN POWER RENTAL MARKET RESEARCH AND ANALYSIS BY END USER, 2023-2031 ($ MILLION)
28. EUROPEAN POWER RENTAL MARKET RESEARCH AND ANALYSIS BY POWER RATING, 2023-2031 ($ MILLION)
29. EUROPEAN POWER RENTAL MARKET RESEARCH AND ANALYSIS BY FUEL, 2023-2031 ($ MILLION)
30. EUROPEAN POWER RENTAL MARKET RESEARCH AND ANALYSIS BY APPLICATION, 2023-2031 ($ MILLION)
31. ASIA-PACIFIC POWER RENTAL MARKET RESEARCH AND ANALYSIS BY COUNTRY, 2023-2031 ($ MILLION)
32. ASIA-PACIFIC POWER RENTAL MARKET RESEARCH AND ANALYSIS BY END USER, 2023-2031 ($ MILLION)
33. ASIA-PACIFIC POWER RENTAL MARKET RESEARCH AND ANALYSIS BY POWER RATING, 2023-2031 ($ MILLION)
34. ASIA-PACIFIC POWER RENTAL MARKET RESEARCH AND ANALYSIS BY FUEL, 2023-2031 ($ MILLION)
35. ASIA-PACIFIC POWER RENTAL MARKET RESEARCH AND ANALYSIS BY APPLICATION, 2023-2031 ($ MILLION)
36. REST OF THE WORLD POWER RENTAL MARKET RESEARCH AND ANALYSIS BY REGION, 2023-2031 ($ MILLION)
37. REST OF THE WORLD POWER RENTAL MARKET RESEARCH AND ANALYSIS BY END USER, 2023-2031 ($ MILLION)
38. REST OF THE WORLD POWER RENTAL MARKET RESEARCH AND ANALYSIS BY POWER RATING, 2023-2031 ($ MILLION)
39. REST OF THE WORLD POWER RENTAL MARKET RESEARCH AND ANALYSIS BY FUEL, 2023-2031 ($ MILLION)
40. REST OF THE WORLD POWER RENTAL MARKET RESEARCH AND ANALYSIS BY APPLICATION, 2023-2031 ($ MILLION)
1. GLOBAL POWER RENTAL MARKET SHARE BY END USER, 2023 VS 2031 (%)
2. GLOBAL POWER RENTAL MARKET SHARE FOR TELECOM AND DATA CENTER BY REGION, 2023 VS 2031 (%)
3. GLOBAL POWER RENTAL MARKET SHARE FOR OIL & GAS BY REGION, 2023 VS 2031 (%)
4. GLOBAL POWER RENTAL MARKET SHARE FOR UTILITIES BY REGION, 2023 VS 2031 (%)
5. GLOBAL POWER RENTAL MARKET SHARE FOR MANUFACTURING BY REGION, 2023 VS 2031 (%)
6. GLOBAL POWER RENTAL MARKET SHARE FOR MINING AND CONSTRUCTION BY REGION, 2023 VS 2031 (%)
7. GLOBAL POWER RENTAL MARKET SHARE FOR OTHER END USERS BY REGION, 2023 VS 2031 (%)
8. GLOBAL POWER RENTAL MARKET SHARE BY POWER RATING, 2023 VS 2031 (%)
9. GLOBAL POWER RENTAL MARKET SHARE UP TO 50 KW BY REGION, 2023 VS 2031 (%)
10. GLOBAL POWER RENTAL MARKET SHARE BETWEEN 51 –500 KWBY REGION, 2023 VS 2031 (%)
11.
12. GLOBAL POWER RENTAL MARKET SHARE BETWEEN 501 –2,500 KW BY REGION, 2023 VS 2031 (%)
13. GLOBAL POWER RENTAL MARKET SHARE ABOVE 2,500 KW BY REGION, 2023 VS 2031 (%)
14. GLOBAL POWER RENTAL MARKET SHARE BY FUEL, 2023 VS 2031 (%)
15. GLOBAL POWER RENTAL MARKET SHARE FOR DIESEL BY REGION, 2023 VS 2031 (%)
16. GLOBAL POWER RENTAL MARKET SHARE FOR GAS BY REGION, 2023 VS 2031 (%)
17. GLOBAL POWER RENTAL MARKET SHARE BY APPLICATION, 2023 VS 2031 (%)
18. GLOBAL STANDBY POWER RENTAL MARKET SHARE BY REGION, 2023 VS 2031 (%)
19. GLOBAL PEAK SHAVING POWER RENTAL MARKET SHARE BY REGION, 2023 VS 2031 (%)
20. GLOBAL PRIME/CONTINUOUS POWER RENTAL MARKET SHARE BY REGION, 2023 VS 2031 (%)
21. GLOBAL POWER RENTAL MARKET SHARE BY REGION, 2023 VS 2031 (%)
22. US POWER RENTAL MARKET SIZE, 2023-2031 ($ MILLION)
23. CANADA POWER RENTAL MARKET SIZE, 2023-2031 ($ MILLION)
24. UK POWER RENTAL MARKET SIZE, 2023-2031 ($ MILLION)
25. FRANCE POWER RENTAL MARKET SIZE, 2023-2031 ($ MILLION)
26. GERMANY POWER RENTAL MARKET SIZE, 2023-2031 ($ MILLION)
27. ITALY POWER RENTAL MARKET SIZE, 2023-2031 ($ MILLION)
28. SPAIN POWER RENTAL MARKET SIZE, 2023-2031 ($ MILLION)
29. REST OF EUROPE POWER RENTAL MARKET SIZE, 2023-2031 ($ MILLION)
30. INDIA POWER RENTAL MARKET SIZE, 2023-2031 ($ MILLION)
31. CHINA POWER RENTAL MARKET SIZE, 2023-2031 ($ MILLION)
32. JAPAN POWER RENTAL MARKET SIZE, 2023-2031 ($ MILLION)
33. SOUTH KOREA POWER RENTAL MARKET SIZE, 2023-2031 ($ MILLION)
34. REST OF ASIA-PACIFIC POWER RENTAL MARKET SIZE, 2023-2031 ($ MILLION)
35. LATIN AMERICA POWER RENTAL MARKET SIZE, 2023-2031 ($ MILLION)
36. THE MIDDLE EAST AND AFRICA POWER RENTAL MARKET SIZE, 2023-2031 ($ MILLION)


