Propionic Acid Market
Propionic Acid Market Size, Share & Trends Analysis Report by Application (Animal Feed & Grain Preservatives, Food Preservative, Herbicides, Cellulose Acetate Propionate (CAP), Pharmaceuticals and Others) Forecast Period (2025-2035)
Industry Overview
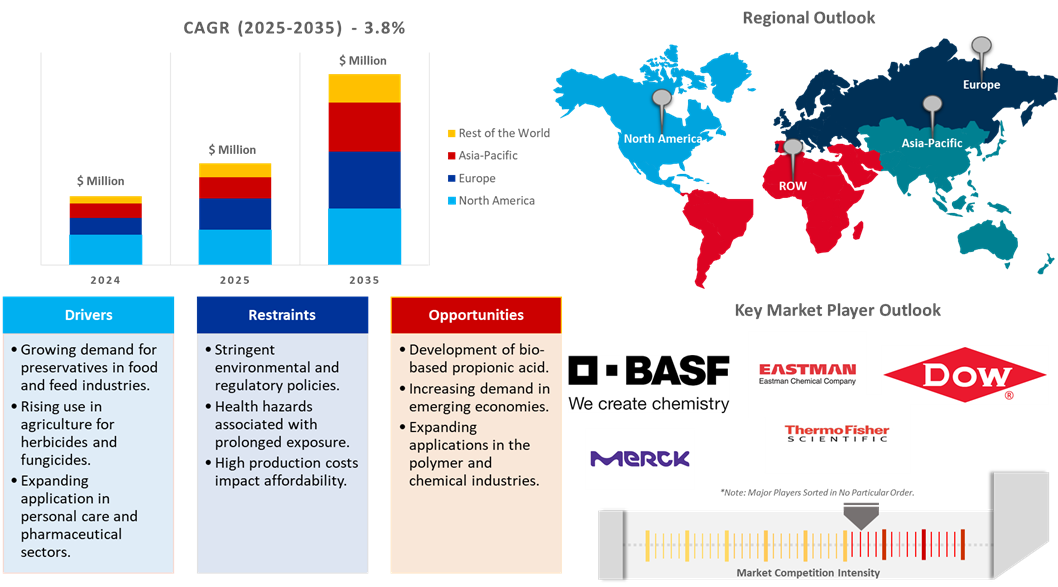
Propionic acid market was valued at $1,250 million and is anticipated to grow at a CAGR of 3.8% during the forecast period (2025-2035). The market for propionic acid is expanding rapidly owing to the increasing usage of propionic acid in the food and beverage industries is one of the primary growth factors for the market growth. Food and beverage preservatives are in high demand, and propionic acid is used as an addition to prolong the shelf life of products such as bread and baked goods, that boosts consumption. Additionally, its use in animal feed to prevent mold growth increases agricultural demand. According to the International Feed Industry Federation (IFIF), global compound animal feed production is estimated at one billion tons annually. Global commercial feed manufacturing generates an estimated annual turnover of over $400 billion.

Market Dynamics
Growing Adoption in Food Preservation
Increasing food preservation usage in the propionic acid market is one of the most prominent trends. Propionic acid and its salts, calcium propionate especially, are heavily used as preservatives in bread, baked products, and processed foods. The major reason behind the usage is that the acid hinders the growth of mold and bacteria, increasing the shelf life of the product. Consumer demand for longer-lasting, safer food products is the reason propionic acid has gained acceptance by the food industry as the preservative of choice. In addition, the clean-label trend and the consumer's desire for natural preservatives are contributing to increased propionic acid usage.
Growing Demand in Animal Feed
Another trend in propionic acid, that is gaining importance and application, has been its role in animal feeds, especially those for poultry and livestock. Being a preservative, propionic acid prevents animals from getting decomposed or mildewed, meaning that it significantly improves the feed quality and its shelf life. As the global demand for meat and dairy products continues to increase, the quality of animal feed is an important concern for the agricultural industry. Furthermore, propionic acid is recognized to enhance animal health by eliminating pathogenic bacteria in feed, which results in better growth and productivity. Increasing application in the agriculture and animal feed industry is thus driving the market for propionic acid further.

Market Segmentation
- Based on the application, the market is segmented into animal feed & grain preservatives, food preservatives, herbicides, cellulose acetate propionate (CAP), pharmaceuticals, and others (plasticizers).
Animal Feed & Grain Preservatives Segment to Lead the Market with the Largest Share
The propionic acid market is growing rapidly, especially owing to its use in animal feed and grain preservation. Propionic acid acts as a good preservative, which prolongs the shelf life of animal feed by preventing mold growth and spoilage. This characteristic is important for ensuring the quality and nutritional value of animal feed. Its utility is varied and one of them is grain storage. Propionic acid has served as a guardian against fungal deterioration of stored grains, increased storability, and reduced waste losses. With the improved feed and grain quality demand arising globally, protecting product integrity holds an even larger significance. For instance, The Dow Chemical Co. offers propionic acid with grain preserver grade. Grain Preserver grade is a product designed to prevent mold growth in grain and grass storage areas. This grade can be used directly on feedstock as is or be diluted by the user and is registered under EPA FIFRA (Federal Insecticide Fungicide Rodenticide Act).
Regional Outlook
The global propionic acid market is further divided by geography, including North America (the US and Canada), Europe (the UK, Germany, France, Italy, Spain, Russia, and the Rest of Europe), Asia-Pacific (India, China, Japan, South Korea, Australia and New Zealand, ASEAN Countries, and the Rest of Asia-Pacific), and the Rest of the World (the Middle East & Africa, and Latin America)
Growing Demand for Propionic Acid in Feed and Industrial Processes in Asia-Pacific
The Asia Pacific propionic acid market is also experiencing growing momentum, attributed to its enhanced applications in diversified markets in this region. Propionic acid is utilized in various industrial applications including animal feed and industrial processes, further increase of major regional manufacturing capabilities such as those of China, India, and Japan continues to support solid and reliable deliveries toward fulfilling a surging demand.
Europe Region Dominates the Market with Major Share
Europe holds a significant share owing to its widespread applications in different industries such as food and feed sectors. The increasing use of the compound as a preservative in food and feed sectors is one of the key drivers. The ability of the compound to inhibit the growth of mold and bacteria ensures the extended shelf life of products, thereby enhancing their demand. The growing demand in the pharmaceuticals industry for propionic acid usage in drug formulations is also witnessing an increase in its market share. Its intermediacy in manufacturing cellulose acetate propionate and herbicides also increases demand. Strict regulation that encourages the usage of safe, biodegradable chemicals further fosters the growth of the market.
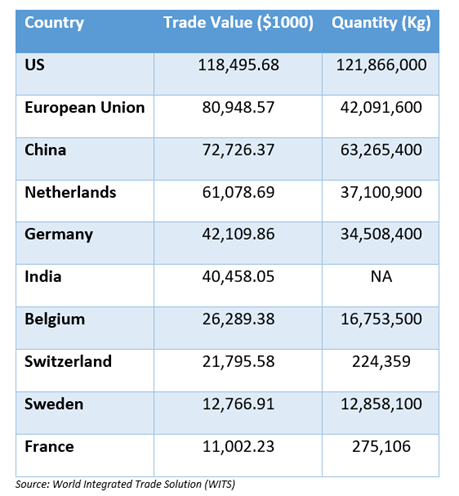
Top 10 Propionic Acid Exporting Country, Trade Value $1000, Quantity, in 2023

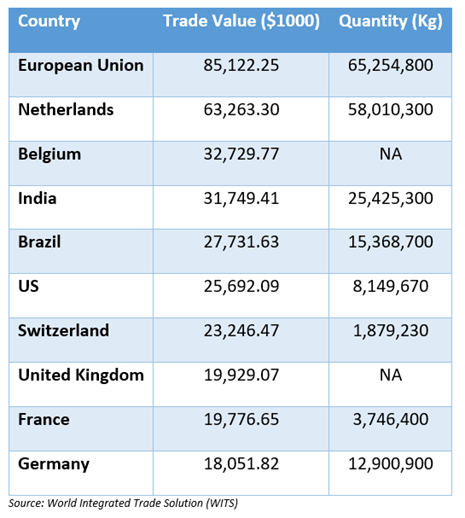
Top 10 Propionic Acid Importing Country, Trade Value $1000, Quantity, in 2023

Market Players Outlook
The major companies operating in the global propionic acid market include BASF SE, Eastman Chemical Co., Merck KGaA, Dow Chemical Co., and Thermo Fisher Scientific Inc., among others. Market players are leveraging partnerships, collaborations, mergers, and acquisition strategies for business expansion and innovative product development to maintain their market positioning.
The Report Covers
- Market value data analysis of 2024 and forecast to 2035.
- Annualized market revenues ($ million) for each market segment.
- Country-wise analysis of major geographical regions.
- Key companies operating in the global propionic acid market. Based on the availability of data, information related to new products, and relevant news is also available in the report.
- Analysis of business strategies by identifying the key market segments positioned for strong growth in the future.
- Analysis of market-entry and market expansion strategies.
- Competitive strategies by identifying ‘who-stands-where’ in the market.
1. Report Summary
• Current Industry Analysis and Growth Potential Outlook
• Global Propionic Acid Market Sales Analysis – Application ($ Million)
• Propionic Acid Market Sales Performance of Top Countries
1.1. Research Methodology
• Primary Research Approach
• Secondary Research Approach
1.2. Market Snapshot
2. Market Overview and Insights
2.1. Scope of the Study
2.2. Analyst Insight & Current Market Trends
2.2.1. Key Propionic Acid Industry Trends
2.2.2. Market Recommendations
2.3. Porter's Five Forces Analysis for the Propionic Acid Market
2.3.1. Competitive Rivalry
2.3.2. Threat of New Entrants
2.3.3. Bargaining Power of Suppliers
2.3.4. Bargaining Power of Buyers
2.3.5. Threat of Substitutes
3. Market Determinants
3.1. Market Drivers
3.1.1. Drivers For Global Propionic Acid Market: Impact Analysis
3.2. Market Pain Points and Challenges
3.2.1. Restraints For Global Propionic Acid Market: Impact Analysis
3.3. Market Opportunities
4. Competitive Landscape
4.1. Competitive Dashboard – Propionic Acid Market Revenue and Share by Manufacturers
• Propionic Acid Product Comparison Analysis
• Top Market Player Ranking Matrix
4.2. Key Company Analysis
4.2.1. BASF SE
4.2.1.1. Overview
4.2.1.2. Product Portfolio
4.2.1.3. Financial Analysis (Subject to Data Availability)
4.2.1.4. SWOT Analysis
4.2.1.5. Business Strategy
4.2.2. Eastman Chemical Co.
4.2.2.1. Overview
4.2.2.2. Product Portfolio
4.2.2.3. Financial Analysis (Subject to Data Availability)
4.2.2.4. SWOT Analysis
4.2.2.5. Business Strategy
4.2.3. Merck KGaA
4.2.3.1. Overview
4.2.3.2. Product Portfolio
4.2.3.3. Financial Analysis (Subject to Data Availability)
4.2.3.4. SWOT Analysis
4.2.3.5. Business Strategy
4.2.4. The Dow Chemical Co.
4.2.4.1. Overview
4.2.4.2. Product Portfolio
4.2.4.3. Financial Analysis (Subject to Data Availability)
4.2.4.4. SWOT Analysis
4.2.4.5. Business Strategy
4.2.5. Thermo Fisher Scientific, Inc.
4.2.5.1. Overview
4.2.5.2. Product Portfolio
4.2.5.3. Financial Analysis (Subject to Data Availability)
4.2.5.4. SWOT Analysis
4.2.5.5. Business Strategy
4.3. Top Winning Strategies by Market Players
4.3.1. Merger and Acquisition
4.3.2. Product Launch
4.3.3. Partnership And Collaboration
5. Global Propionic Acid Market Sales Analysis by Application ($ Million)
5.1. Animal Feed & Grain Preservatives
5.2. Food Preservative
5.3. Herbicides
5.4. Cellulose Acetate Propionate (CAP)
5.5. Pharmaceuticals
5.6. Others (Plasticizers)
6. Regional Analysis
6.1. North American Propionic Acid Market Sales Analysis – Application| Country ($ Million)
• Macroeconomic Factors for North America
6.1.1. United States
6.1.2. Canada
6.2. European Propionic Acid Market Sales Analysis – Application| Country ($ Million)
• Macroeconomic Factors for North America
6.2.1. UK
6.2.2. Germany
6.2.3. Italy
6.2.4. Spain
6.2.5. France
6.2.6. Russia
6.2.7. Rest of Europe
6.3. Asia-Pacific Propionic Acid Market Sales Analysis – Application| Country ($ Million)
• Macroeconomic Factors for Asia-Pacific
6.3.1. China
6.3.2. Japan
6.3.3. South Korea
6.3.4. India
6.3.5. Australia & New Zealand
6.3.6. ASEAN Countries (Thailand, Indonesia, Vietnam, Singapore, And Other)
6.3.7. Rest of Asia-Pacific
6.4. Rest of the World Propionic Acid Market Sales Analysis – Application| Country ($ Million)
• Macroeconomic Factors for the Rest of the World
6.4.1. Latin America
6.4.2. Middle East and Africa
7. Company Profiles
7.1. ACETO US, LLC
7.1.1. Quick Facts
7.1.2. Company Overview
7.1.3. Product Portfolio
7.1.4. Business Strategies
7.2. ADDEASY BIO-TECHNOLOGY CO., LTD.
7.2.1. Quick Facts
7.2.2. Company Overview
7.2.3. Product Portfolio
7.2.4. Business Strategies
7.3. Alfa Chemistry
7.3.1. Quick Facts
7.3.2. Company Overview
7.3.3. Product Portfolio
7.3.4. Business Strategies
7.4. ATAMAN KIMYA A.S
7.4.1. Quick Facts
7.4.2. Company Overview
7.4.3. Product Portfolio
7.4.4. Business Strategies
7.5. BASF SE
7.5.1. Quick Facts
7.5.2. Company Overview
7.5.3. Product Portfolio
7.5.4. Business Strategies
7.6. Cayman Chemical
7.6.1. Quick Facts
7.6.2. Company Overview
7.6.3. Product Portfolio
7.6.4. Business Strategies
7.7. Drägerwerk AG & Co. KGaA
7.7.1. Quick Facts
7.7.2. Company Overview
7.7.3. Product Portfolio
7.7.4. Business Strategies
7.8. Eastman Chemical Co.
7.8.1. Quick Facts
7.8.2. Company Overview
7.8.3. Product Portfolio
7.8.4. Business Strategies
7.9. Ernesto Ventós S.A.
7.9.1. Quick Facts
7.9.2. Company Overview
7.9.3. Product Portfolio
7.9.4. Business Strategies
7.10. Fengchen Group Co., Ltd.
7.10.1. Quick Facts
7.10.2. Company Overview
7.10.3. Product Portfolio
7.10.4. Business Strategies
7.11. Glentham® Life Sciences Ltd.
7.11.1. Quick Facts
7.11.2. Company Overview
7.11.3. Product Portfolio
7.11.4. Business Strategies
7.12. JenKem Technology USA Inc.
7.12.1. Quick Facts
7.12.2. Company Overview
7.12.3. Product Portfolio
7.12.4. Business Strategies
7.13. Junsei Chemical Co., Ltd.
7.13.1. Quick Facts
7.13.2. Company Overview
7.13.3. Product Portfolio
7.13.4. Business Strategies
7.14. Kemin Industries, Inc.
7.14.1. Quick Facts
7.14.2. Company Overview
7.14.3. Product Portfolio
7.14.4. Business Strategies
7.15. Merck KGaA
7.15.1. Quick Facts
7.15.2. Company Overview
7.15.3. Product Portfolio
7.15.4. Business Strategies
7.16. Molekula Group
7.16.1. Quick Facts
7.16.2. Company Overview
7.16.3. Product Portfolio
7.16.4. Business Strategies
7.17. OQ Chemicals GmbH
7.17.1. Quick Facts
7.17.2. Company Overview
7.17.3. Product Portfolio
7.17.4. Business Strategies
7.18. Scharlab S.L.
7.18.1. Quick Facts
7.18.2. Company Overview
7.18.3. Product Portfolio
7.18.4. Business Strategies
7.19. The Dow Chemical Co.
7.19.1. Quick Facts
7.19.2. Company Overview
7.19.3. Product Portfolio
7.19.4. Business Strategies
7.20. The Perstorp Group
7.20.1. Quick Facts
7.20.2. Company Overview
7.20.3. Product Portfolio
7.20.4. Business Strategies
7.21. Theorem Chemical Technology Co., Ltd.
7.21.1. Quick Facts
7.21.2. Company Overview
7.21.3. Product Portfolio
7.21.4. Business Strategies
7.22. Thermo Fisher Scientific Inc.
7.22.1. Quick Facts
7.22.2. Company Overview
7.22.3. Product Portfolio
7.22.4. Business Strategies
7.23. Tokyo Chemical Industry Co., Ltd. (TCI)
7.23.1. Quick Facts
7.23.2. Company Overview
7.23.3. Product Portfolio
7.23.4. Business Strategies
7.24. Xinhua Pharma. I&E Co., Ltd.
7.24.1. Quick Facts
7.24.2. Company Overview
7.24.3. Product Portfolio
7.24.4. Business Strategies
7.25. Zibo Anquan Chemical Co., Ltd.
7.25.1. Quick Facts
7.25.2. Company Overview
7.25.3. Product Portfolio
7.25.4. Business Strategies
1. Global Propionic Acid Market Research And Analysis By Application, 2024-2035 ($ Million)
2. Global Propionic Acid For Animal Feed & Grain Preservatives Market Research And Analysis By Region, 2024-2035 ($ Million)
3. Global Propionic Acid For Food Preservative Market Research And Analysis By Region, 2024-2035 ($ Million)
4. Global Propionic Acid For Herbicides Market Research And Analysis By Region, 2024-2035 ($ Million)
5. Global Propionic Acid For Cellulose Acetate Propionate (CAP) Market Research And Analysis By Region, 2024-2035 ($ Million)
6. Global Propionic Acid For Pharmaceuticals Market Research And Analysis By Region, 2024-2035 ($ Million)
7. Global Propionic Acid For Others Application Market Research And Analysis By Region, 2024-2035 ($ Million)
8. Global Propionic Acid Market Research And Analysis By Region, 2024-2035 ($ Million)
9. North American Propionic Acid Market Research And Analysis By Country, 2024-2035 ($ Million)
10. North American Propionic Acid Market Research And Analysis By Application, 2024-2035 ($ Million)
11. European Propionic Acid Market Research And Analysis By Country, 2024-2035 ($ Million)
12. European Propionic Acid Market Research And Analysis By Application, 2024-2035 ($ Million)
13. Asia-Pacific Propionic Acid Market Research And Analysis By Country, 2024-2035 ($ Million)
14. Asia-Pacific Propionic Acid Market Research And Analysis By Application, 2024-2035 ($ Million)
15. Rest Of The World Propionic Acid Market Research And Analysis By Region, 2024-2035 ($ Million)
16. Rest Of The World Propionic Acid Market Research And Analysis By Application, 2024-2035 ($ Million)
1. Global Propionic Acid Market Share By Application, 2024 Vs 2035 (%)
2. Global Propionic Acid For Animal Feed & Grain Preservatives Market Share By Region, 2024 Vs 2035 (%)
3. Global Propionic Acid For Food Preservative Market Share By Region, 2024 Vs 2035 (%)
4. Global Propionic Acid For Herbicides Market Share By Region, 2024 Vs 2035 (%)
5. Global Propionic Acid For Cellulose Acetate Propionate (CAP) Market Share By Region, 2024 Vs 2035 (%)
6. Global Propionic Acid For Pharmaceuticals Market Share By Region, 2024 Vs 2035 (%)
7. Global Propionic Acid For Others Application Market Share By Region, 2024 Vs 2035 (%)
8. Global Propionic Acid Market Share By Region, 2024 Vs 2035 (%)
9. US Propionic Acid Market Size, 2024-2035 ($ Million)
10. Canada Propionic Acid Market Size, 2024-2035 ($ Million)
11. UK Propionic Acid Market Size, 2024-2035 ($ Million)
12. France Propionic Acid Market Size, 2024-2035 ($ Million)
13. Germany Propionic Acid Market Size, 2024-2035 ($ Million)
14. Italy Propionic Acid Market Size, 2024-2035 ($ Million)
15. Spain Propionic Acid Market Size, 2024-2035 ($ Million)
16. Russia Propionic Acid Market Size, 2024-2035 ($ Million)
17. Rest Of Europe Propionic Acid Market Size, 2024-2035 ($ Million)
18. India Propionic Acid Market Size, 2024-2035 ($ Million)
19. China Propionic Acid Market Size, 2024-2035 ($ Million)
20. Japan Propionic Acid Market Size, 2024-2035 ($ Million)
21. South Korea Propionic Acid Market Size, 2024-2035 ($ Million)
22. Australia and New Zealand Propionic Acid Market Size, 2024-2035 ($ Million)
23. ASEAN Economies Propionic Acid Market Size, 2024-2035 ($ Million)
24. Rest Of Asia-Pacific Propionic Acid Market Size, 2024-2035 ($ Million)
25. Latin America Propionic Acid Market Size, 2024-2035 ($ Million)
26. Middle East And Africa Propionic Acid Market Size, 2024-2035 ($ Million)
FAQS
The size of the Propionic Acid market in 2024 is estimated to be around $1,250 million.
Europe holds the largest share in the Propionic Acid market.
Leading players in the Propionic Acid market include BASF SE, Eastman Chemical Co., Merck KGaA, Dow Chemical Co., and Thermo Fisher Scientific Inc., among others.
Propionic Acid market is expected to grow at a CAGR of 6.2% from 2025 to 2035.
The Propionic Acid Market is growing due to increasing demand in food preservation, animal feed, agriculture, pharmaceuticals, industrial applications, regulatory support, and expanding emerging markets.


