Restaurant Point-of-Sale (POS) Terminals Market
Global Restaurant Point-of-Sale (POS) Terminals Market Size, Share & Trends Analysis Report, By Product (Fixed and Mobile), By Deployment (Cloud-based and On-Premise), By End-User (FSR, QSR, Institutional, and Others) and Forecast, 2020-2026 Update Available - Forecast 2025-2031
The global restaurant point-of-sale (POS) terminals market is estimated to grow at a CAGR of 7.8% during the forecast period. Expansion of food outlets and emerging demand for advanced payment options in the restaurants are primarily leveraging the adoption of POS terminals. An increasing number of food outlets have been witnessed owing to the rising shift towards western-style diets. Several major food outlets such as McDonald’s, Domino’s Pizza, and Pizza Hut have been reported expansion across the globe to meet the increased consumption of fast foods across the globe. For instance, in April 2020, McDonald's Corp. declared its plans to expand in Russia's far east in December 2020. This aims to open restaurants in cities including Vladivostok and Khabarovsk for the first time.
In 2020, McDonald's Corp. is continuing to actively invest in Russia’s economy and increase its presence on the market. The expansion of these food retail outlets is driving the demand for POS terminals that supports manage restaurant sales, improve & enhance customer service, manage inventory, control finances, and facilitate marketing. The system facilitates communications between the kitchen and the wait staff. McDonald’s Corporation serves more than 68 million customers every day. With the use of Amazon Web Services (AWS), McDonald’s can complete 8,600 transactions per second through its POS system. In 2016, McDonald’s Corporation using AWS to support McDonald’s build a secure, scalable digital platform.
Since later, McDonald’s has increased its digital capabilities globally through Mobile Order and Pay, and Delivery, Kiosks, and Digital Menu Boards. In 2019, McDonald’s Corp. acquired Dynamic Yield Ltd. a provider of personalization and decision logic technology. McDonald’s will use Dynamic Yield decision technology to offer a more personalized customer experience through changing outdoor digital Drive Thru menu displays. This will enable McDonald’s to display food based on trending menu items, time of day, current restaurant traffic, and weather. With the use of data, Dynamic Yield decision technology can also promptly recommend and display additional items to the order of customers according to their current selections. This will support McDonald’s to become one of the first companies that combined decision technology into the customer POS at a brick and mortar location. In 2018, McDonald’s tested this technology in multiple US restaurants.
Market Segmentation
The global restaurant POS terminals market is segmented based on product, deployment, and end-user. Based on the product, the market is classified into fixed and mobile POS terminals. Based on deployment, the market is classified into cloud-based and on-premise. Based on end-user, the market is classified into FSR, QSR, institutional, and others.
Mobile Restaurant POS Terminals to Witness Significant Growth During the Forecast Period
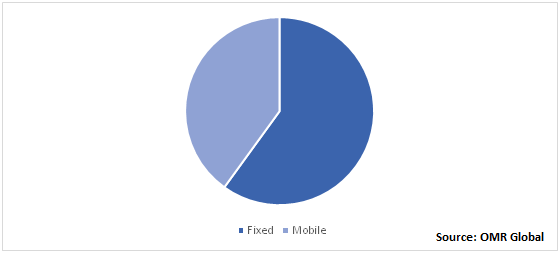
Mobile restaurant POS terminals are expected to witness potential growth during the forecast period. Mobile POS systems enable restaurants to retain customers and enhance sales all while utilizing their smartphones or tablets. Potential mobile POS systems can operate effortlessly on comparatively low-cost hardware and offer an easy-to-use interface that significantly augments the value to the operator. Additionally, the integration of the online ordering tool into the mobile POS system led restaurants in increasing their reach and widen their customer base. Mobile POS systems enable restaurants to improve their service ordering as it allows efficient and fast payments through payment gateways, proper selection of food items through seamless menu integration, facilitates live tracking of orders, and direct receipt generation upon payment.
Global Restaurant POS Terminals Market Share by Product, 2019 (%)

Regional Outlook
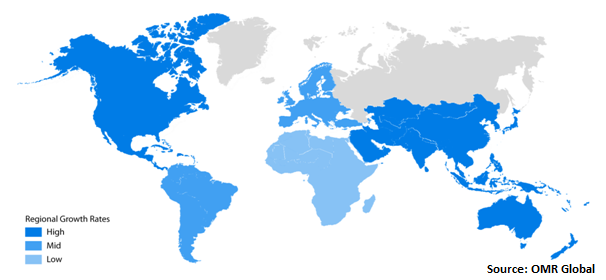
Geographically, the Asia-Pacific restaurant POS terminals market is estimated to grow at the fastest CAGR during the forecast period owing to the expansion of food outlets and the increasing number of restaurants in the region. Domino's Pizza and McDonald’s are some major fast-food outlets that are significantly expanding their outlets in the region. Domino’s have more than 1,250 stores present all over India. Additionally, by the end of June 2020, Pizza Hut had more than 2,200 restaurants in over 500 cities across China. Additionally, it had over 75 million digital members, and digital orders represented over 60% of sales in the first half of 2020. This results in an increasing demand for POS terminals in the region that is primarily utilized in physical retail stores for processing card payments and other applications.
Global Restaurant POS Terminals Market Growth, by Region 2020-2026

Market Players Outlook
Some prominent players in the market include NCR Corp., HP, Inc., Ingenico Group, Toshiba Corp., and Mad Mobile, Inc. Product launches and mergers and acquisitions are some key strategic initiatives adopted by the market players to leverage their market share. For instance, in November 2019, NCR Corp. declared the acquisition of POS Solutions, a provider of POS and restaurant solutions in central Texas, US. This acquisition will further widen access to NCR’s restaurant technology. NCR solutions such as the NCR Aloha Essentials subscription package and signature NCR Aloha point-of-sale platform offer everything restaurants require to run their business, leverage efficiency, and enhance growth. This will increase NCR capabilities to offer solutions and serve its customers in local restaurant markets, including Austin.
The Report Covers
- Market value data analysis of 2019 and forecast to 2026.
- Annualized market revenues ($ million) for each market segment.
- Country-wise analysis of major geographical regions.
- Key companies operating in the global restaurant POS terminals market. Based on the availability of data, information related to pipeline products, and relevant news is also available in the report.
- Analysis of business strategies by identifying the key market segments positioned for strong growth in the future.
- Analysis of market-entry and market expansion strategies.
- Competitive strategies by identifying ‘who-stands-where’ in the market.
1. Report Summary
1.1. Research Methods and Tools
1.2. Market Breakdown
1.2.1. By Segments
1.2.2. By Geography
2. Market Overview and Insights
2.1. Scope of the Report
2.2. Analyst Insight & Current Market Trends
2.2.1. Key Findings
2.2.2. Recommendations
2.2.3. Conclusion
3. Competitive Landscape
3.1. Company Share Analysis
3.2. Key Strategy Analysis
3.3. Key Company Analysis
3.3.1. NCR Corp.
3.3.1.1. Overview
3.3.1.2. Financial Analysis
3.3.1.3. SWOT Analysis
3.3.1.4. Recent Developments
3.3.2. HP, Inc.
3.3.2.1. Overview
3.3.2.2. Financial Analysis
3.3.2.3. SWOT Analysis
3.3.2.4. Recent Developments
3.3.3. Ingenico Group
3.3.3.1. Overview
3.3.3.2. Financial Analysis
3.3.3.3. SWOT Analysis
3.3.3.4. Recent Developments
3.3.4. Toshiba Corp.
3.3.4.1. Overview
3.3.4.2. Financial Analysis
3.3.4.3. SWOT Analysis
3.3.4.4. Recent Developments
3.3.5. Mad Mobile, Inc.
3.3.5.1. Overview
3.3.5.2. Financial Analysis
3.3.5.3. SWOT Analysis
3.3.5.4. Recent Developments
4. Market Determinants
4.1 Motivators
4.2 Restraints
4.3 Opportunities
5. Market Segmentation
5.1. Global Restaurant POS Terminals Market by Product
5.1.1. Fixed
5.1.2. Mobile
5.2. Global Restaurant POS Terminals Market by Deployment
5.2.1. Cloud-Based
5.2.2. On-Premise
5.3. Global Restaurant POS Terminals Market by End-User
5.3.1. Full-Service Restaurant (FSR)
5.3.2. Quick Service Restaurant (QSR)
5.3.3. Institutional
5.3.4. Others
6. Regional Analysis
6.1. North America
6.1.1. United States
6.1.2. Canada
6.2. Europe
6.2.1. UK
6.2.2. Germany
6.2.3. Italy
6.2.4. Spain
6.2.5. France
6.2.6. Rest of Europe
6.3. Asia-Pacific
6.3.1. China
6.3.2. India
6.3.3. Japan
6.3.4. Rest of Asia-Pacific
6.4. Rest of the World
7. Company Profiles
7.1. Aireus, Inc.
7.2. Clover Network, Inc. (Fiserv)
7.3. Diebold Nixdorf, Inc.
7.4. Epos Now, Ltd.
7.5. HP, Inc.
7.6. Ingenico Group
7.7. Lavu, Inc.
7.8. Lightspeed POS, Inc.
7.9. Mad Mobile, Inc.
7.10. NCR Corp.
7.11. NEC Corp.
7.12. Oracle Corp.
7.13. Panasonic Corp.
7.14. PAR Technology Corp.
7.15. PAX Technology
7.16. Posera, Ltd.
7.17. POSist Technologies Pvt. Ltd.
7.18. Revel Systems, Inc.
7.19. Samsung Electronics Co., Ltd.
7.20. Shift4 Payments, LLC
7.21. Square, Inc.
7.22. Squirrel Systems
7.23. Toast, Inc.
7.24. Toshiba Corp.
7.25. TouchBistro, Inc.
7.26. Upserve, Inc.
7.27. VeriFone, Inc.
1. GLOBAL RESTAURANT POS TERMINALS MARKET RESEARCH AND ANALYSIS BYPRODUCT, 2019-2026 ($ MILLION)
2. GLOBAL FIXED RESTAURANT POS TERMINALS MARKET RESEARCH AND ANALYSIS BY REGION, 2019-2026 ($ MILLION)
3. GLOBAL MOBILE RESTAURANT POS TERMINALS MARKET RESEARCH AND ANALYSIS BY REGION, 2019-2026 ($ MILLION)
4. GLOBAL RESTAURANT POS TERMINALS MARKET RESEARCH AND ANALYSIS BY DEPLOYMENT, 2019-2026 ($ MILLION)
5. GLOBAL CLOUD-BASED RESTAURANT POS TERMINALS MARKET RESEARCH AND ANALYSIS BY REGION, 2019-2026 ($ MILLION)
6. GLOBAL ON-PREMISE RESTAURANT POS TERMINALS MARKET RESEARCH AND ANALYSIS BY REGION, 2019-2026 ($ MILLION)
7. GLOBAL RESTAURANT POS TERMINALS MARKET RESEARCH AND ANALYSIS BY END-USER, 2019-2026 ($ MILLION)
8. GLOBAL RESTAURANT POS TERMINALS IN FSR MARKET RESEARCH AND ANALYSIS BY REGION, 2019-2026 ($ MILLION)
9. GLOBAL RESTAURANT POS TERMINALS IN QSR MARKET RESEARCH AND ANALYSIS BY REGION, 2019-2026 ($ MILLION)
10. GLOBAL RESTAURANT POS TERMINALS IN INSTITUTIONAL MARKET RESEARCH AND ANALYSIS BY REGION, 2019-2026 ($ MILLION)
11. GLOBAL RESTAURANT POS TERMINALS IN OTHER END-USERS MARKET RESEARCH AND ANALYSIS BY REGION, 2019-2026 ($ MILLION)
12. GLOBAL RESTAURANT POS TERMINALS MARKET RESEARCH AND ANALYSIS BY GEOGRAPHY, 2019-2026 ($ MILLION)
13. NORTH AMERICAN RESTAURANT POS TERMINALS MARKET RESEARCH AND ANALYSIS BY COUNTRY, 2019-2026 ($ MILLION)
14. NORTH AMERICAN RESTAURANT POS TERMINALS MARKET RESEARCH AND ANALYSIS BY PRODUCT, 2019-2026 ($ MILLION)
15. NORTH AMERICAN RESTAURANT POS TERMINALS MARKET RESEARCH AND ANALYSIS BY DEPLOYMENT, 2019-2026 ($ MILLION)
16. NORTH AMERICAN RESTAURANT POS TERMINALS MARKET RESEARCH AND ANALYSIS BY APPLICATION, 2019-2026 ($ MILLION)
17. EUROPEAN RESTAURANT POS TERMINALS MARKET RESEARCH AND ANALYSIS BY COUNTRY, 2019-2026 ($ MILLION)
18. EUROPEAN RESTAURANT POS TERMINALS MARKET RESEARCH AND ANALYSIS BY PRODUCT, 2019-2026 ($ MILLION)
19. EUROPEAN RESTAURANT POS TERMINALS MARKET RESEARCH AND ANALYSIS BY DEPLOYMENT, 2019-2026 ($ MILLION)
20. EUROPEAN RESTAURANT POS TERMINALS MARKET RESEARCH AND ANALYSIS BY END-USER, 2019-2026 ($ MILLION)
21. ASIA-PACIFIC RESTAURANT POS TERMINALS MARKET RESEARCH AND ANALYSIS BY COUNTRY, 2019-2026 ($ MILLION)
22. ASIA-PACIFIC RESTAURANT POS TERMINALS MARKET RESEARCH AND ANALYSIS BY PRODUCT, 2019-2026 ($ MILLION)
23. ASIA-PACIFIC RESTAURANT POS TERMINALS MARKET RESEARCH AND ANALYSIS BY DEPLOYMENT, 2019-2026 ($ MILLION)
24. ASIA-PACIFIC RESTAURANT POS TERMINALS MARKET RESEARCH AND ANALYSIS BY END-USER, 2019-2026 ($ MILLION)
25. REST OF THE WORLD RESTAURANT POS TERMINALS MARKET RESEARCH AND ANALYSIS BY PRODUCT, 2019-2026 ($ MILLION)
26. REST OF THE WORLD RESTAURANT POS TERMINALS MARKET RESEARCH AND ANALYSIS BY DEPLOYMENT, 2019-2026 ($ MILLION)
27. REST OF THE WORLD RESTAURANT POS TERMINALS MARKET RESEARCH AND ANALYSIS BY END-USER, 2019-2026 ($ MILLION)
1. GLOBAL RESTAURANT POS TERMINALS MARKET SHARE BY PRODUCT, 2019 VS 2026 (%)
2. GLOBAL RESTAURANT POS TERMINALS MARKET RESEARCH AND ANALYSIS BY DEPLOYMENT, 2019-2026 ($ MILLION)
3. GLOBAL RESTAURANT POS TERMINALS MARKET RESEARCH AND ANALYSIS BY END-USER, 2019-2026 ($ MILLION)
4. GLOBAL RESTAURANT POS TERMINALS MARKET SHARE BY GEOGRAPHY, 2019 VS 2026 (%)
5. US RESTAURANT POS TERMINALS MARKET SIZE, 2019-2026 ($ MILLION)
6. CANADA RESTAURANT POS TERMINALS MARKET SIZE, 2019-2026 ($ MILLION)
7. UK RESTAURANT POS TERMINALS MARKET SIZE, 2019-2026 ($ MILLION)
8. FRANCE RESTAURANT POS TERMINALS MARKET SIZE, 2019-2026 ($ MILLION)
9. GERMANY RESTAURANT POS TERMINALS MARKET SIZE, 2019-2026 ($ MILLION)
10. ITALY RESTAURANT POS TERMINALS MARKET SIZE, 2019-2026 ($ MILLION)
11. SPAIN RESTAURANT POS TERMINALS MARKET SIZE, 2019-2026 ($ MILLION)
12. ROE RESTAURANT POS TERMINALS MARKET SIZE, 2019-2026 ($ MILLION)
13. INDIA RESTAURANT POS TERMINALS MARKET SIZE, 2019-2026 ($ MILLION)
14. CHINA RESTAURANT POS TERMINALS MARKET SIZE, 2019-2026 ($ MILLION)
15. JAPAN RESTAURANT POS TERMINALS MARKET SIZE, 2019-2026 ($ MILLION)
16. REST OF ASIA-PACIFIC RESTAURANT POS TERMINALS MARKET SIZE, 2019-2026 ($ MILLION)
17. REST OF THE WORLD RESTAURANT POS TERMINALS MARKET SIZE, 2019-2026 ($ MILLION)


