Ship-to-Shore (STS) Cranes Market
Global Ship-to-Shore (STS) Cranes Market Size, Share & Trends Analysis Report, By Power Supply (Electric, Diesel, and Hybrid), By Outreach (<40, 40-49, 50-60, and >60) and Forecast, 2020-2026 Update Available - Forecast 2025-2031
The global ship-to-shore (STS) market is estimated to grow at a CAGR of nearly 6.2% during the forecast period. The major factors contributing to the market growth include rising maritime trade and increasing demand for port equipment. The increasing demand for maritime trade has led by rising international trade. Approximately 80% of the global trade is conducted by the sea which increases the need for ports across the globe. In 2017, the handling of bulk and containerized cargo and port activity increased rapidly across the globe. The container terminals across the globe have shown the rise in the volume of nearly 6% in 2017, rose from 2.1% in 2016. The global container port throughput reached at 752 million twenty-foot equivalent units (TEUs), which shows an additional 42.3 million TEUs in 2017. This leads to the increasing demand for STS cranes which is the most crucial equipment in container port terminals.
With the accelerating fast-paced container port terminals, quick ship turnaround times can provide the port with a major competitive advantage. STS cranes are custom built as crane design has to meet the technical needs of the individual client, as well as climatic conditions and specific standards. STC cranes are constantly rising in size, which is contributing to the improvement in speeds and load capacities. This is also influencing the demand for backup equipment including straddle carriers, rail-mounted gantries (RMG), and rubber tyred gantries (RTG). This, in turn, leverages the operational efficiency in port terminals for safe and faster loading and unloading of containers.
Market Segmentation
The global STS cranes market is segmented based on the power supply and outreach. Based on the power supply, the market is classified into electric, diesel, and hybrid. Based on outreach, the market is classified into <40, 40-49, 50-60, and >60.
Hybrid STS cranes are estimated to witness potential growth during the forecast period
Hybrid STS cranes are estimated to grow significantly during the forecast period owing to the increasing focus of port operators on reducing greenhouse gas (GHG) emissions. The increasing need for container terminals for quick handling of containers resulting in more automation and simultaneously operating STS cranes, which leads to a high peak in the demand for electricity. Therefore, larger handling speeds of containers leads to a further increase in energy costs, resulting in considerable operational costs.
The demand for hybrid RTG crane has been experiencing growth as the terminal operators are looking forward to reducing their fuel costs while decreasing emissions. Energy storage systems have been utilized in RTG crane systems to enhance energy savings and decrease GHG emissions under different control algorithms. As hybrid cranes are driven by energy storage systems, it supports fuel savings of up to 65% with the further advantages of reduced noise levels and operating costs and lowering greenhouse gas emissions at the container terminals. Therefore, it is considered as highly efficient than conventional diesel-electric port cranes.
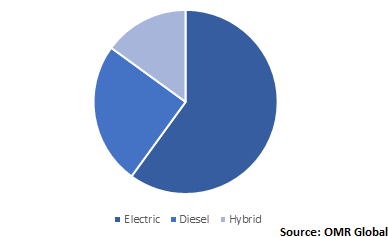
Global STS Cranes Market Share by Power Supply, 2019 (%)

Regional Outlook
The global STS cranes market is classified into North America, Europe, Asia-Pacific, and Rest of the World (RoW). Asia-Pacific is estimated to experience considerable growth during the forecast period owing to the increasing focus on improving port infrastructure. In 2013, China’s Belt and Road Initiative (BRI) was introduced which is a major port infrastructure project in the country. Under the initiative, China is investing nearly $1 trillion to connect trade hubs and ports from the Pacific to Northern Europe. With the growing exports to other countries, China is significantly focusing on improving maritime transportation. This, in turn, is accelerating the need for port equipment and thereby driving the demand for STS cranes in ports.
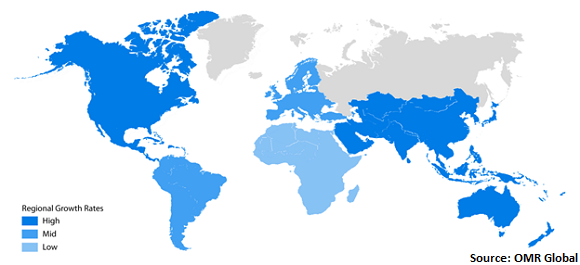
Global STS Cranes Market Growth, by Region 2020-2026

Market Players Outlook
The major players operating in the market include Shanghai Zhenhua Heavy Industries Co., Ltd. (ZPMC), Liebherr Group, Konecranes, Cargotec Corp., and Anupam Industries Ltd. The market players are constantly focusing on gaining major market share by adopting mergers & acquisitions, geographical expansion, product launch, and partnerships and collaborations. For instance, in May 2020, Abu Dhabi Terminals received five new STS cranes from Shanghai Zhenhua Heavy Industry Co. Ltd. (ZMPC) in China, as a part of its continued expansion efforts. Each of these new five STS cranes with a 52-metre height, a lifting capacity of 90 tonnes, and 73-metre reach are integral to striving plans which is intended to increase capacity at Khalifa Port Container Terminal (KPCT) to 5 million TEU (twenty foot equivalent units) by the end of 2020. This will play a crucial role in the technologically advanced operational environment of Abu Dhabi Terminals at Khalifa Port.
The Report Covers
- Market value data analysis of 2019 and forecast to 2026.
- Annualized market revenues ($ million) for each market segment.
- Country-wise analysis of major geographical regions.
- Key companies operating in the global STS cranes market. Based on the availability of data, information related to pipeline products, and relevant news is also available in the report.
- Analysis of business strategies by identifying the key market segments positioned for strong growth in the future.
- Analysis of market-entry and market expansion strategies.
- Competitive strategies by identifying ‘who-stands-where’ in the market.
1. Report Summary
1.1. Research Methods and Tools
1.2. Market Breakdown
1.2.1. By Segments
1.2.2. By Geography
2. Market Overview and Insights
2.1. Scope of the Report
2.2. Analyst Insight & Current Market Trends
2.2.1. Key Findings
2.2.2. Recommendations
2.2.3. Conclusion
3. Competitive Landscape
3.1. Company Share Analysis
3.2. Key Strategy Analysis
3.3. Key Company Analysis
3.3.1. Shanghai Zhenhua Heavy Industries Co., Ltd. (ZPMC)
3.3.1.1. Overview
3.3.1.2. Financial Analysis
3.3.1.3. SWOT Analysis
3.3.1.4. Recent Developments
3.3.2. Liebherr Group
3.3.2.1. Overview
3.3.2.2. Financial Analysis
3.3.2.3. SWOT Analysis
3.3.2.4. Recent Developments
3.3.3. Konecranes
3.3.3.1. Overview
3.3.3.2. Financial Analysis
3.3.3.3. SWOT Analysis
3.3.3.4. Recent Developments
3.3.4. Cargotec Corp.
3.3.4.1. Overview
3.3.4.2. Financial Analysis
3.3.4.3. SWOT Analysis
3.3.4.4. Recent Developments
3.3.5. Anupam Industries Ltd.
3.3.5.1. Overview
3.3.5.2. Financial Analysis
3.3.5.3. SWOT Analysis
3.3.5.4. Recent Developments
4. Market Determinants
4.1 Motivators
4.2 Restraints
4.3 Opportunities
5. Market Segmentation
5.1. Global STS Cranes Market by Power Supply
5.1.1. Electric
5.1.2. Diesel
5.1.3. Hybrid
5.2. Global STS Cranes Market by Outreach
5.2.1. < 40
5.2.2. 40-49
5.2.3. 50-60
5.2.4. > 60
6. Regional Analysis
6.1. North America
6.1.1. United States
6.1.2. Canada
6.2. Europe
6.2.1. UK
6.2.2. Germany
6.2.3. Italy
6.2.4. Spain
6.2.5. France
6.2.6. Rest of Europe
6.3. Asia-Pacific
6.3.1. China
6.3.2. India
6.3.3. Japan
6.3.4. Rest of Asia-Pacific
6.4. Rest of the World
7. Company Profiles
7.1. Anupam Industries Ltd.
7.2. BTG Positioning Systems
7.3. Conductix-Wampfler Group
7.4. Contship Italia S.p.a.
7.5. Gantrex
7.6. Hartmann & König AG
7.7. Kalmar (Part of Cargotec Corp.)
7.8. Kocks Ardelt Kranbau GmbH
7.9. Konecranes
7.10. Liebherr-International Deutschland GmbH
7.11. Mac Port - Macchine Operatrici Portuali SRL
7.12. Nidec ASI S.p.A.
7.13. Noell Crane Systems (China) Ltd.
7.14. SANY Group Co., Ltd.
7.15. Shanghai Zhenhua Heavy Industries Co., Ltd. (ZPMC)
7.16. SKF Group
7.17. Toshiba Mitsubishi-Electric Industrial Systems Corp. (TMEIC)
7.18. Weihua Group
7.19. Wison Group
1. GLOBAL STS CRANES MARKET RESEARCH AND ANALYSIS BY POWER SUPPLY, 2019-2026 ($ MILLION)
2. GLOBAL ELECTRIC STS CRANES MARKET RESEARCH AND ANALYSIS BY REGION, 2019-2026 ($ MILLION)
3. GLOBAL DIESEL STS CRANES MARKET RESEARCH AND ANALYSIS BY REGION, 2019-2026 ($ MILLION)
4. GLOBAL HYBRID STS CRANES MARKET RESEARCH AND ANALYSIS BY REGION, 2019-2026 ($ MILLION)
5. GLOBAL STS CRANES MARKET RESEARCH AND ANALYSIS BY OUTREACH, 2019-2026 ($ MILLION)
6. GLOBAL <40 STS CRANES MARKET RESEARCH AND ANALYSIS BY REGION, 2019-2026 ($ MILLION)
7. GLOBAL 40-49 STS CRANES MARKET RESEARCH AND ANALYSIS BY REGION, 2019-2026 ($ MILLION)
8. GLOBAL 50-60 STS CRANES MARKET RESEARCH AND ANALYSIS BY REGION, 2019-2026 ($ MILLION)
9. GLOBAL >60 STS CRANES MARKET RESEARCH AND ANALYSIS BY REGION, 2019-2026 ($ MILLION)
10. GLOBAL STS CRANES MARKET RESEARCH AND ANALYSIS BY GEOGRAPHY, 2019-2026 ($ MILLION)
11. NORTH AMERICAN STS CRANES MARKET RESEARCH AND ANALYSIS BY COUNTRY, 2019-2026 ($ MILLION)
12. NORTH AMERICAN STS CRANES MARKET RESEARCH AND ANALYSIS BY POWER SUPPLY, 2019-2026 ($ MILLION)
13. NORTH AMERICAN STS CRANES MARKET RESEARCH AND ANALYSIS BY OUTREACH, 2019-2026 ($ MILLION)
14. EUROPEAN STS CRANES MARKET RESEARCH AND ANALYSIS BY COUNTRY, 2019-2026 ($ MILLION)
15. EUROPEAN STS CRANES MARKET RESEARCH AND ANALYSIS BY POWER SUPPLY, 2019-2026 ($ MILLION)
16. EUROPEAN STS CRANES MARKET RESEARCH AND ANALYSIS BY OUTREACH, 2019-2026 ($ MILLION)
17. ASIA-PACIFIC STS CRANES MARKET RESEARCH AND ANALYSIS BY COUNTRY, 2019-2026 ($ MILLION)
18. ASIA-PACIFIC STS CRANES MARKET RESEARCH AND ANALYSIS BY POWER SUPPLY, 2019-2026 ($ MILLION)
19. ASIA-PACIFIC STS CRANES MARKET RESEARCH AND ANALYSIS BY OUTREACH, 2019-2026 ($ MILLION)
20. REST OF THE WORLD STS CRANES MARKET RESEARCH AND ANALYSIS BY POWER SUPPLY, 2019-2026 ($ MILLION)
21. REST OF THE WORLD STS CRANES MARKET RESEARCH AND ANALYSIS BY OUTREACH, 2019-2026 ($ MILLION)
1. GLOBAL STS CRANES MARKET SHARE BY POWER SUPPLY, 2019 VS 2026 (%)
2. GLOBAL STS CRANES MARKET SHARE BY OUTREACH, 2019 VS 2026 (%)
3. GLOBAL STS CRANES MARKET SHARE BY GEOGRAPHY, 2019 VS 2026 (%)
4. US STS CRANES MARKET SIZE, 2019-2026 ($ MILLION)
5. CANADA STS CRANES MARKET SIZE, 2019-2026 ($ MILLION)
6. UK STS CRANES MARKET SIZE, 2019-2026 ($ MILLION)
7. FRANCE STS CRANES MARKET SIZE, 2019-2026 ($ MILLION)
8. GERMANY STS CRANES MARKET SIZE, 2019-2026 ($ MILLION)
9. ITALY STS CRANES MARKET SIZE, 2019-2026 ($ MILLION)
10. SPAIN STS CRANES MARKET SIZE, 2019-2026 ($ MILLION)
11. ROE STS CRANES MARKET SIZE, 2019-2026 ($ MILLION)
12. INDIA STS CRANES MARKET SIZE, 2019-2026 ($ MILLION)
13. CHINA STS CRANES MARKET SIZE, 2019-2026 ($ MILLION)
14. JAPAN STS CRANES MARKET SIZE, 2019-2026 ($ MILLION)
15. REST OF ASIA-PACIFIC STS CRANES MARKET SIZE, 2019-2026 ($ MILLION)
16. REST OF THE WORLD STS CRANES MARKET SIZE, 2019-2026 ($ MILLION)


