Solar Farms Market
Solar Farms Market Size, Share & Trends Analysis Report by Type (Utility-scale, Community Scale, Distributed Generation, Microgrids, and Others), and by End-User (Residential, Commercial, and Industrial) Forecast Period (2024-2031)
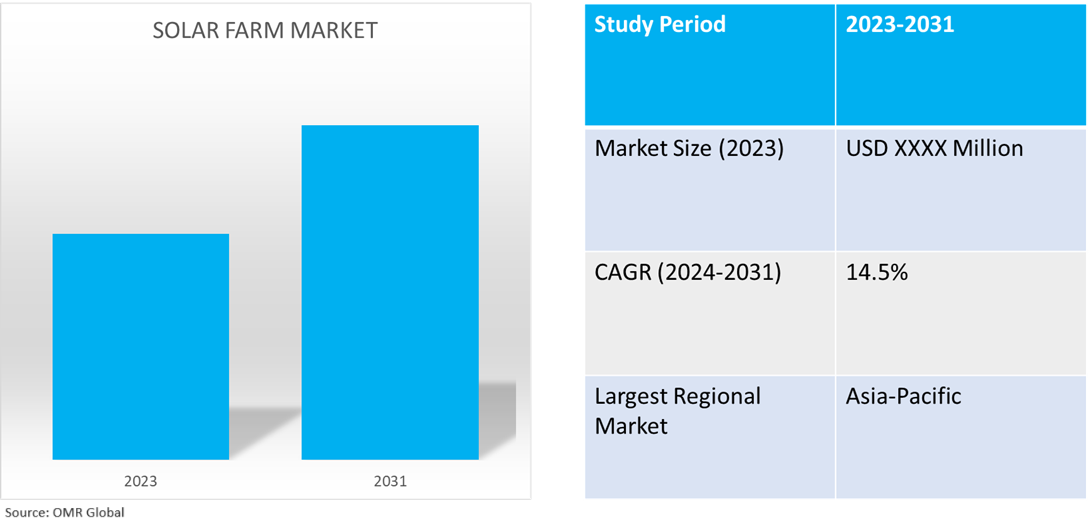
Solar farms market is anticipated to grow at a CAGR of 14.5% during the forecast period (2024-2031). The market growth is driven by the rising investment in solar energy production, increasing government efforts for energy diversification. The declining cost of solar electricity generation infrastructure by substantial government support through policies, subsidies, and schemes, and global emission reduction targets are other contributors to the global market growth.

Market Dynamics
Shift Towards Renewable Energy Supply Sources
In recent years, the global energy production and supply market has recorded a shifting trend toward the adoption of renewable energy sources for energy production including hydro, wind, and solar. The carbon footprint reduction targets of major countries, the high rate of adoption of solar energy by fossil fuel-dependent countries, and the reduction in prices of renewable energy infrastructure are driving the demand for solar farms. For instance, as per the International Energy Agency, Solar PV generation increased by a record 270 TWh (up 26.0%) in 2022, reaching almost 1,300 TWh. It demonstrated the largest absolute generation growth of all renewable technologies in 2022, surpassing wind for the first time in history. This generation growth rate matches the level envisaged from 2023 to 2030 in the Net Zero Emissions by 2050 Scenario. Continuous growth in the economic attractiveness of PV, massive development in the supply chain, and increasing policy support, especially in China, the US, the European Union, and India, are expected to further accelerate capacity growth in the future.
Reduction in Solar PV and Related Infrastructure Cost
The significant cost-reduction in PV solar cells, inverters, and related infrastructure has significantly increased the adoption of solar farms in various countries across residential, commercial, and industrial setups. For instance, the National Renewable Energy Laboratory (NREL) in the US reported a dramatic, though now sustained, drop in costs over the last decade (2010-2020), driven mostly by photovoltaic (PV) module efficiencies (2020 19.5%, up from 19.2% in 2019) and hardware and inverter costs. Since 2010, the costs of residential, commercial rooftop, and utility-scale PV systems have decreased by 64.0%, 69.0%, and 82.0%, respectively. As in prior years, soft costs continue to account for a significant share of installation costs for both solar and storage systems, particularly commercial and residential systems. Also, according to World of Global Data, electricity from utility-scale solar photovoltaics cost $359.0 per megawatt hour in 2009. Within a decade, the price dropped by 89.0%, and the relative price flipped: the electricity price required to break even with the new average coal plant is now significantly more than the cost of establishing a wind or solar plant.
Segmental Outlook
- Based on type, the market is segmented into utility-scale, community-scale, distributed generation, microgrids, and others (agrovoltaic systems, floating solar farms).
- Based on end-users, the market is segmented into residential, commercial, and industrial.
Utility-scale farms are the Most Prominent Solar Farms Type
Utility-scale solar farms are the most preferred kind of solar farms and are growing owing to their applicability at city-level residential electricity sourcing projects, practicality in terms of cost, storage, & economies of scale, land availability, and government subsidies on the solar farm type. For instance, TotalEnergies launched commercial operations for Myrtle Solar, its utility-scale solar farm in the US. Myrtle, located south of Houston, Texas, has a peak solar production capacity of 380 megawatts (MWp) and 225 megawatt hours (MWh) of co-located batteries. With 705,000 ground-mounted solar panels spread over an area comparable to 1,800 American football fields, Myrtle generates enough green electricity to power 70,000 homes.
The Commercial is the Biggest End-User Segment
Commercial end-user dominates the segment attributed to growing industrial usage of renewable energy sources due to low variable and fixed costs for implanting solar farms for electricity generation, and the presence of government schemes and subsidies. For instance, Mitsubishi Heavy Industries (MHI) Group celebrated the opening of the Brighter Future Solar project, which has successfully attained a Commercial Operation in January 2022. Blue Ridge Energy will receive clean power from the 15.7MWdc/11MWac solar photovoltaic (PV) project in North Carolina, the US.
Regional Outlook
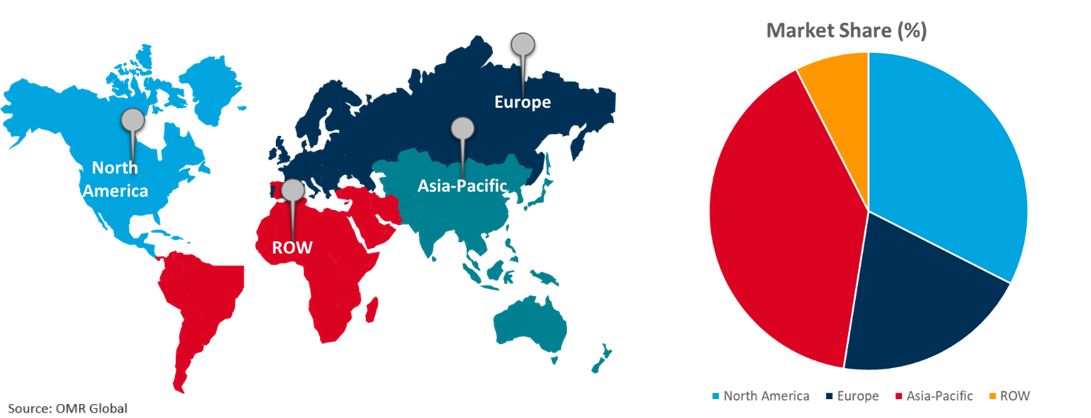
The global solar farms market is further segmented based on geography including North America (the US, and Canada), Europe (the UK, Italy, Spain, Germany, France, and the Rest of Europe), Asia-Pacific (India, China, Japan, South Korea, and Rest of Asia-Pacific), and the Rest of the World (the Middle East & Africa, and Latin America).
Global Solar Farms Market Growth by Region 2024-2031

Asia-pacific is projected to Exhibit the Highest CAGR
Asia-Pacific is projected to exhibit the highest CAGR globally due to the ongoing increase in renewable source-based energy production, rising investment by the regional government to strengthen solar electricity generation capabilities, and ample support from state-run organizations for solar projects through subsidies, and other non-monetary benefits. As per the International Energy Agency (IEA) Since 2011, China has invested $50 billion in new PV supply capacity, ten times more than Europe. This has resulted in the creation of over 300,000 manufacturing jobs across the PV value chain. At present, China accounts for more than 80.0% of solar panel manufacturing (including polysilicon, ingots, wafers, cells, and modules). This is more than quadruple China's proportion of worldwide PV demand. The high production of solar farm equipment across the region is further driving the regional market growth.
Market Players Outlook

*Note: Major Players Sorted in No Particular Order “.
The major companies serving the global solar farms market include Adani Group (Adani Green Energy Ltd.), AES Corp., Brookfield Corp. (Brookfield Renewable Partners LP), Canadian Solar Inc., and EDF Renewables among others. The market players are focusing on capitalizing on growth by adopting strategies such as collaboration, partnerships, and market expansion among others. For instance, in April 2024, Co-op announced the signing of a Power Purchase Agreement (PPA) to use clean energy generated by ScottishPower Renewables' Coldham solar farm in Cambridgeshire. Under this deal, Co-op will receive 100.0% of the electricity generated by the 9MW site's approximately 19,000 cutting-edge solar panels.
The Report Covers
- Market value data analysis of 2023 and forecast to 2031.
- Annualized market revenues ($ million) for each market segment.
- Country-wise analysis of major geographical regions.
- Key companies operating in the global solar farms market. Based on the availability of data, information related to new product launches, and relevant news is also available in the report.
- Analysis of business strategies by identifying the key market segments positioned for strong growth in the future.
- Analysis of market-entry and market expansion strategies.
- Competitive strategies by identifying ‘who-stands-where’ in the market.
1. Report Summary
• Current Industry Analysis and Growth Potential Outlook
1.1. Research Methods and Tools
1.2. Market Breakdown
1.2.1. By Segments
1.2.2. By Region
2. Market Overview and Insights
2.1. Scope of the Report
2.2. Analyst Insight & Current Market Trends
2.2.1. Key Findings
2.2.2. Recommendations
2.2.3. Conclusion
3. Competitive Landscape
3.1. Key Company Analysis
3.2. Adani Group (Adani Green Energy Ltd.)
3.2.1. Overview
3.2.2. Financial Analysis
3.2.3. SWOT Analysis
3.2.4. Recent Developments
3.3. AES Corp.
3.3.1. Overview
3.3.2. Financial Analysis
3.3.3. SWOT Analysis
3.3.4. Recent Developments
3.4. Brookfield Corp.(Brookfield Renewable Partners LP)
3.4.1. Overview
3.4.2. Financial Analysis
3.4.3. SWOT Analysis
3.4.4. Recent Developments
3.5. Canadian Solar Inc.
3.5.1. Overview
3.5.2. Financial Analysis
3.5.3. SWOT Analysis
3.5.4. Recent Developments
3.6. EDF Renewables
3.6.1. Overview
3.6.2. Financial Analysis
3.6.3. SWOT Analysis
3.6.4. Recent Developments
3.7. Key Strategy Analysis
4. Market Segmentation
4.1. Global Solar Farms Market by Type
4.1.1. Utility-Scale
4.1.2. Community Scale
4.1.3. Distributed Generation
4.1.4. Microgrids
4.1.5. Others (Agrovoltaic Systems, Floating Solar Farms)
4.2. Global Solar Farms Market by End-User
4.2.1. Residential
4.2.2. Commercial
4.2.3. Industrial
5. Regional Analysis
5.1. North America
5.1.1. United States
5.1.2. Canada
5.2. Europe
5.2.1. UK
5.2.2. Germany
5.2.3. Italy
5.2.4. Spain
5.2.5. France
5.2.6. Rest of Europe
5.3. Asia-Pacific
5.3.1. China
5.3.2. India
5.3.3. Japan
5.3.4. South Korea
5.3.5. Rest of Asia-Pacific
5.4. Rest of the World
5.4.1. Latin America
5.4.2. Middle East and Africa
6. Company Profiles
6.1. Cypress Creek Renewables, LLC
6.2. Enel Green Power S.p.A.
6.3. First Solar, Inc.
6.4. GruppoSTG
6.5. Iberdrola, S.A.
6.6. ib vogt GmbH
6.7. Invenergy LLC
6.8. Ja Solar Holdings Co. Ltd
6.9. JinkoSolar Holding Co., Ltd.
6.10. Sharp Corp.
6.11. Shenzhen Topray Solar Co., Ltd.
6.12. SunPower Corp.
6.13. Tata Power Solar Systems Ltd
6.14. Trina Solar
6.15. TotalEnergies SE
1. GLOBAL SOLAR FARMS MARKET RESEARCH AND ANALYSIS BY TYPE, 2023-2031 ($ MILLION)
2. GLOBAL UTILITY-SCALE SOLAR FARMS MARKET RESEARCH AND ANALYSIS BY REGION, 2023-2031 ($ MILLION)
3. GLOBAL COMMUNITY SCALE SOLAR FARMS MARKET RESEARCH AND ANALYSIS BY REGION, 2023-2031 ($ MILLION)
4. GLOBAL DISTRIBUTION GENERATION SOLAR FARMS MARKET RESEARCH AND ANALYSIS BY REGION, 2023-2031 ($ MILLION)
5. GLOBAL MICROGRIDS SOLAR FARMS MARKET RESEARCH AND ANALYSIS BY REGION, 2023-2031 ($ MILLION)
6. GLOBAL OTHER SOLAR FARMS MARKET RESEARCH AND ANALYSIS BY REGION, 2023-2031 ($ MILLION)
7. GLOBAL SOLAR FARMS MARKET RESEARCH AND ANALYSIS BY END-USER, 2023-2031 ($ MILLION)
8. GLOBAL SOLAR FARMS FOR RESIDENTIAL MARKET RESEARCH AND ANALYSIS BY REGION, 2023-2031 ($ MILLION)
9. GLOBAL SOLAR FARMS ANALYSIS FOR COMMERCIAL MARKET RESEARCH AND BY REGION, 2023-2031 ($ MILLION)
10. GLOBAL SOLAR FARMS FOR INDUSTRIAL MARKET RESEARCH AND ANALYSIS BY REGION, 2023-2031 ($ MILLION)
11. GLOBAL SOLAR FARMS MARKET RESEARCH AND ANALYSIS BY REGION, 2023-2031 ($ MILLION)
12. NORTH AMERICAN SOLAR FARMS MARKET RESEARCH AND ANALYSIS BY COUNTRY, 2023-2031 ($ MILLION)
13. NORTH AMERICAN SOLAR FARMS MARKET RESEARCH AND ANALYSIS BY TYPE, 2023-2031 ($
14. NORTH AMERICAN SOLAR FARMS MARKET RESEARCH AND ANALYSIS BY END-USER, 2023-2031 ($ MILLION)
15. EUROPEAN SOLAR FARMS MARKET RESEARCH AND ANALYSIS BY COUNTRY, 2023-2031 ($ MILLION)
16. EUROPEAN SOLAR FARMS MARKET RESEARCH AND ANALYSIS BY TYPE, 2023-2031 ($ MILLION)
17. EUROPEAN SOLAR FARMS MARKET RESEARCH AND ANALYSIS BY END-USER, 2023-2031 ($ MILLION)
18. ASIA-PACIFIC SOLAR FARMS MARKET RESEARCH AND ANALYSIS BY COUNTRY, 2023-2031 ($ MILLION)
19. ASIA-PACIFIC SOLAR FARMS MARKET RESEARCH AND ANALYSIS BY TYPE, 2023-2031 ($ MILLION)
20. ASIA-PACIFIC SOLAR FARMS MARKET RESEARCH AND ANALYSIS BY END-USER, 2023-2031 ($ MILLION)
21. REST OF THE WORLD SOLAR FARMS MARKET RESEARCH AND ANALYSIS BY REGION, 2023-2031 ($ MILLION)
22. REST OF THE WORLD SOLAR FARMS MARKET RESEARCH AND ANALYSIS BY TYPE, 2023-2031 ($ MILLION)
23. REST OF THE WORLD SOLAR FARMS MARKET RESEARCH AND ANALYSIS BY END-USER, 2023-2031 ($ MILLION)
1. GLOBAL SOLAR FARMS MARKET SHARE BY TYPE, 2023 VS 2031 (%)
2. GLOBAL UTILITY-SCALE SOLAR FARMS MARKET SHARE BY REGION, 2023 VS 2031 (%)
3. GLOBAL COMMUNITY-SCALE SOLAR FARMS MARKET SHARE BY REGION, 2023 VS 2031 (%)
4. GLOBAL DISTRIBUTION GENERATION SOLAR FARMS MARKET SHARE BY REGION, 2023 VS 2031 (%)
5. GLOBAL MICROGRIDS SOLAR FARMS MARKET SHARE BY REGION, 2023 VS 2031 (%)
6. GLOBAL OTHER SOLAR FARMS MARKET SHARE BY REGION, 2023 VS 2031 (%)
7. GLOBAL SOLAR FARMS MARKET SHARE BY END-USER, 2023 VS 2031 (%)
8. GLOBAL SOLAR FARMS FOR RESIDENTIAL MARKET SHARE BY REGION, 2023 VS 2031 (%)
9. GLOBAL SOLAR FARMS FOR COMMERCIAL MARKET SHARE BY REGION, 2023 VS 2031 (%)
10. GLOBAL SOLAR FARMS FOR INDUSTRIAL MARKET SHARE BY REGION, 2023 VS 2031 (%)
11. GLOBAL SOLAR FARMS MARKET SHARE BY REGION, 2023 VS 2031 (%)
12. US SOLAR FARMS MARKET SIZE, 2023-2031 ($ MILLION)
13. CANADA SOLAR FARMS MARKET SIZE, 2023-2031 ($ MILLION)
14. UK SOLAR FARMS MARKET SIZE, 2023-2031 ($ MILLION)
15. FRANCE SOLAR FARMS MARKET SIZE, 2023-2031 ($ MILLION)
16. GERMANY SOLAR FARMS MARKET SIZE, 2023-2031 ($ MILLION)
17. ITALY SOLAR FARMS MARKET SIZE, 2023-2031 ($ MILLION)
18. SPAIN SOLAR FARMS MARKET SIZE, 2023-2031 ($ MILLION)
19. REST OF EUROPE SOLAR FARMS MARKET SIZE, 2023-2031 ($ MILLION)
20. INDIA SOLAR FARMS MARKET SIZE, 2023-2031 ($ MILLION)
21. CHINA SOLAR FARMS MARKET SIZE, 2023-2031 ($ MILLION)
22. JAPAN SOLAR FARMS MARKET SIZE, 2023-2031 ($ MILLION)
23. SOUTH KOREA SOLAR FARMS MARKET SIZE, 2023-2031 ($ MILLION)
24. REST OF ASIA-PACIFIC SOLAR FARMS MARKET SIZE, 2023-2031 ($ MILLION)
25. LATIN AMERICA SOLAR FARMS MARKET SIZE, 2023-2031 ($ MILLION)
26. MIDDLE EAST AND AFRICA SOLAR FARMS MARKET SIZE, 2023-2031 ($ MILLION)


